Visualizing modules to build trading strategies - a basic understanding
Author: Inventors quantify - small dreams, Created: 2019-07-08 09:23:59, Updated: 2024-12-23 17:57:33
Visualize modules to build trading strategies
Visualizing programming has always been a coveted goal of software tool developers, even in the field of quantitative trading. This is because the way to visualize this kind of puzzle is to reduce the technical threshold for programming development. Users will no longer have to deal with a bunch of boring code, but will simply use their imagination and logical thinking to focus on the business itself. It's amazing to be able to implement a program of your own choice.
So let's get into the field of visualization programming to quantify trading strategies!
- ## Quantified visualization programming by the original inventor
Sign inhttps://www.fmz.comAfter that, you can register your account (if you have already registered, log in directly) by clicking on Control Center - > Policy Library - > Create new policy.
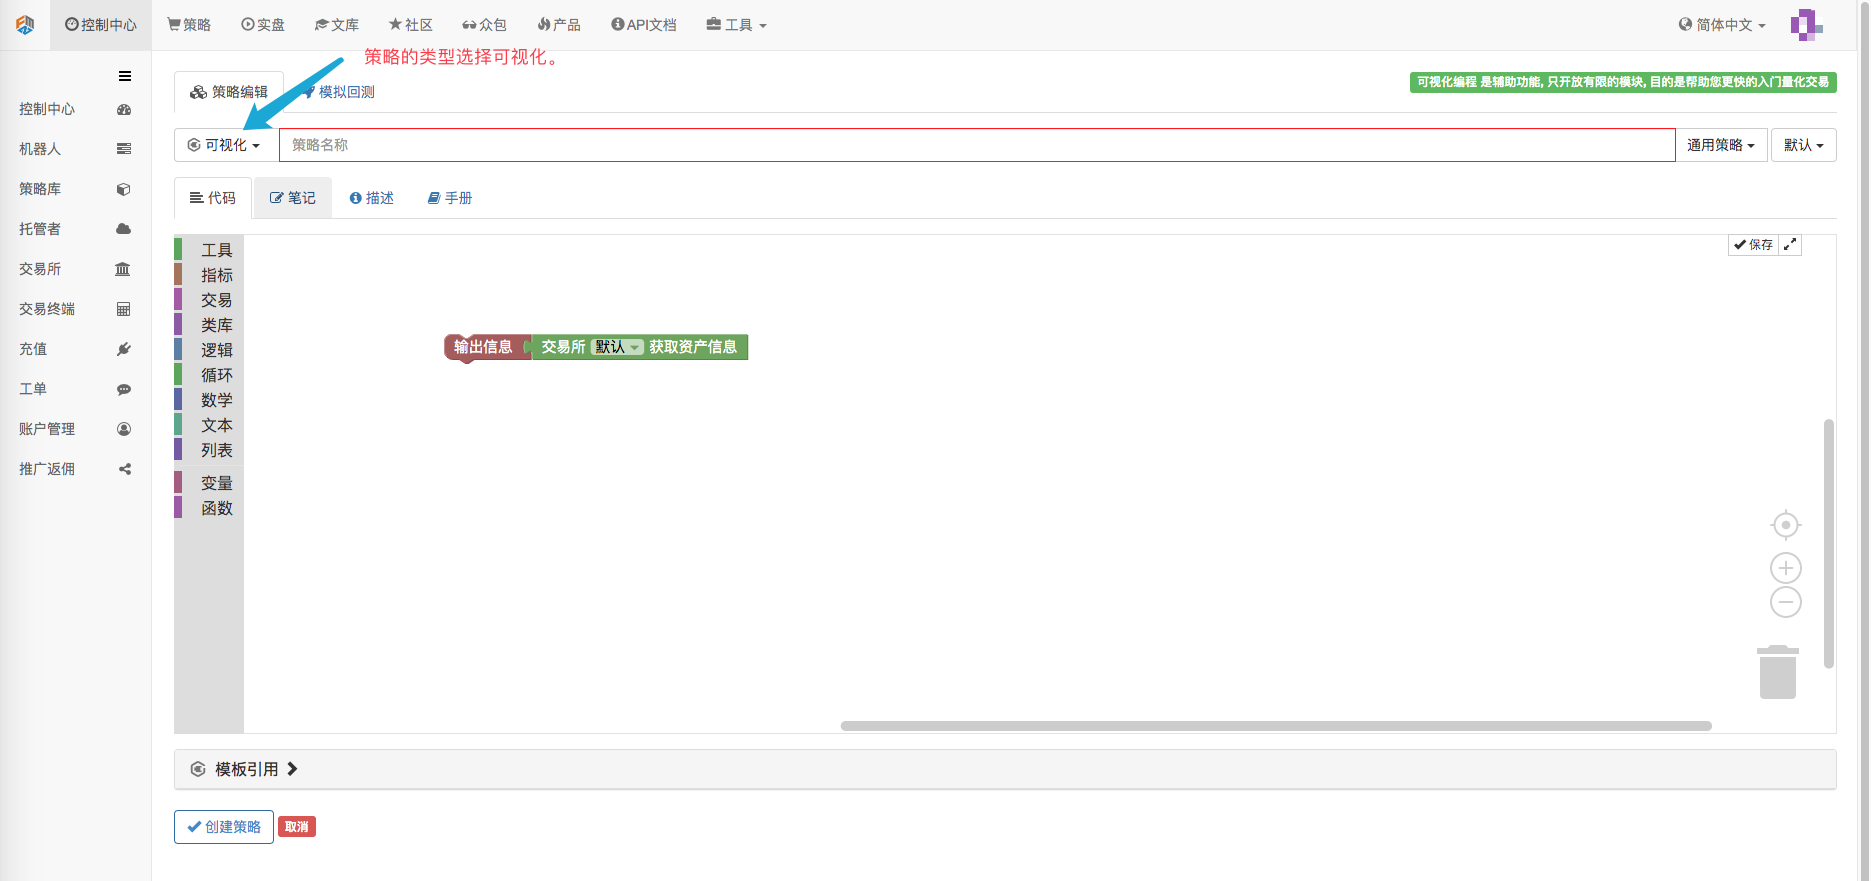
We can see an initial visualization strategy. The function is simply to output the account asset information of the default configured exchange (retest or on the robot, the first exchange object added). (Figure below)

## Before we start learning how to use visualization, we can understand some of the design concepts of visualization.
-
One, spell.
Careful observation reveals that the modules are both convex and convex, meaning that the modules can be "connected" and "connected". If the functional code represented by the two modules can be connected, then you will be attracted to each other when you bring the two modules together.

-
Module setup and adjustment
Some modules have special settings, such as:

You can drag the left-hand "item" module to the "join" module to add a "spell" position, which adds a spell text position. This allows you to pass, click on the gearbox, and make some adjustments and settings to the module.
-
3, the default input parameters of the module
Some modules require input of parameters, such as numbers, strings, etc. If the variable is not added as the input parameter of the module, the module is executed according to the default input parameter.
 A computation module like this, which takes the square root of the sum of its digits, produces the result of this module.
 As you can see, if the input parameter is left out, the square root of 9 is calculated using the default value of 9 as the input parameter.
Of course, if you want to use a variable module as an input parameter, you can directly spell the variable module in the
( ) position. 
-
4, operation
Modules can be pointed and dragged with the left mouse button. Modules can be copied and pasted using Ctrl + C and Ctrl + V, which is as easy as copying and pasting code or text. The operating area can be scaled up with a mouse slide, and all modules can be scaled up or down. Drag the space in the operating area, which can move the operating area. On the right side of the trash can, record the most recently deleted modules. Most importantly, spell out the module policy and don't forget to save.
-
Visualization tools and module introduction
You can see that there are a lot of module classifications on the left side of the visualization editor, and there are a lot of visualization modules available for each category item.
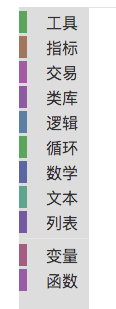 In total, there are 11 categories.
-
The tool module:
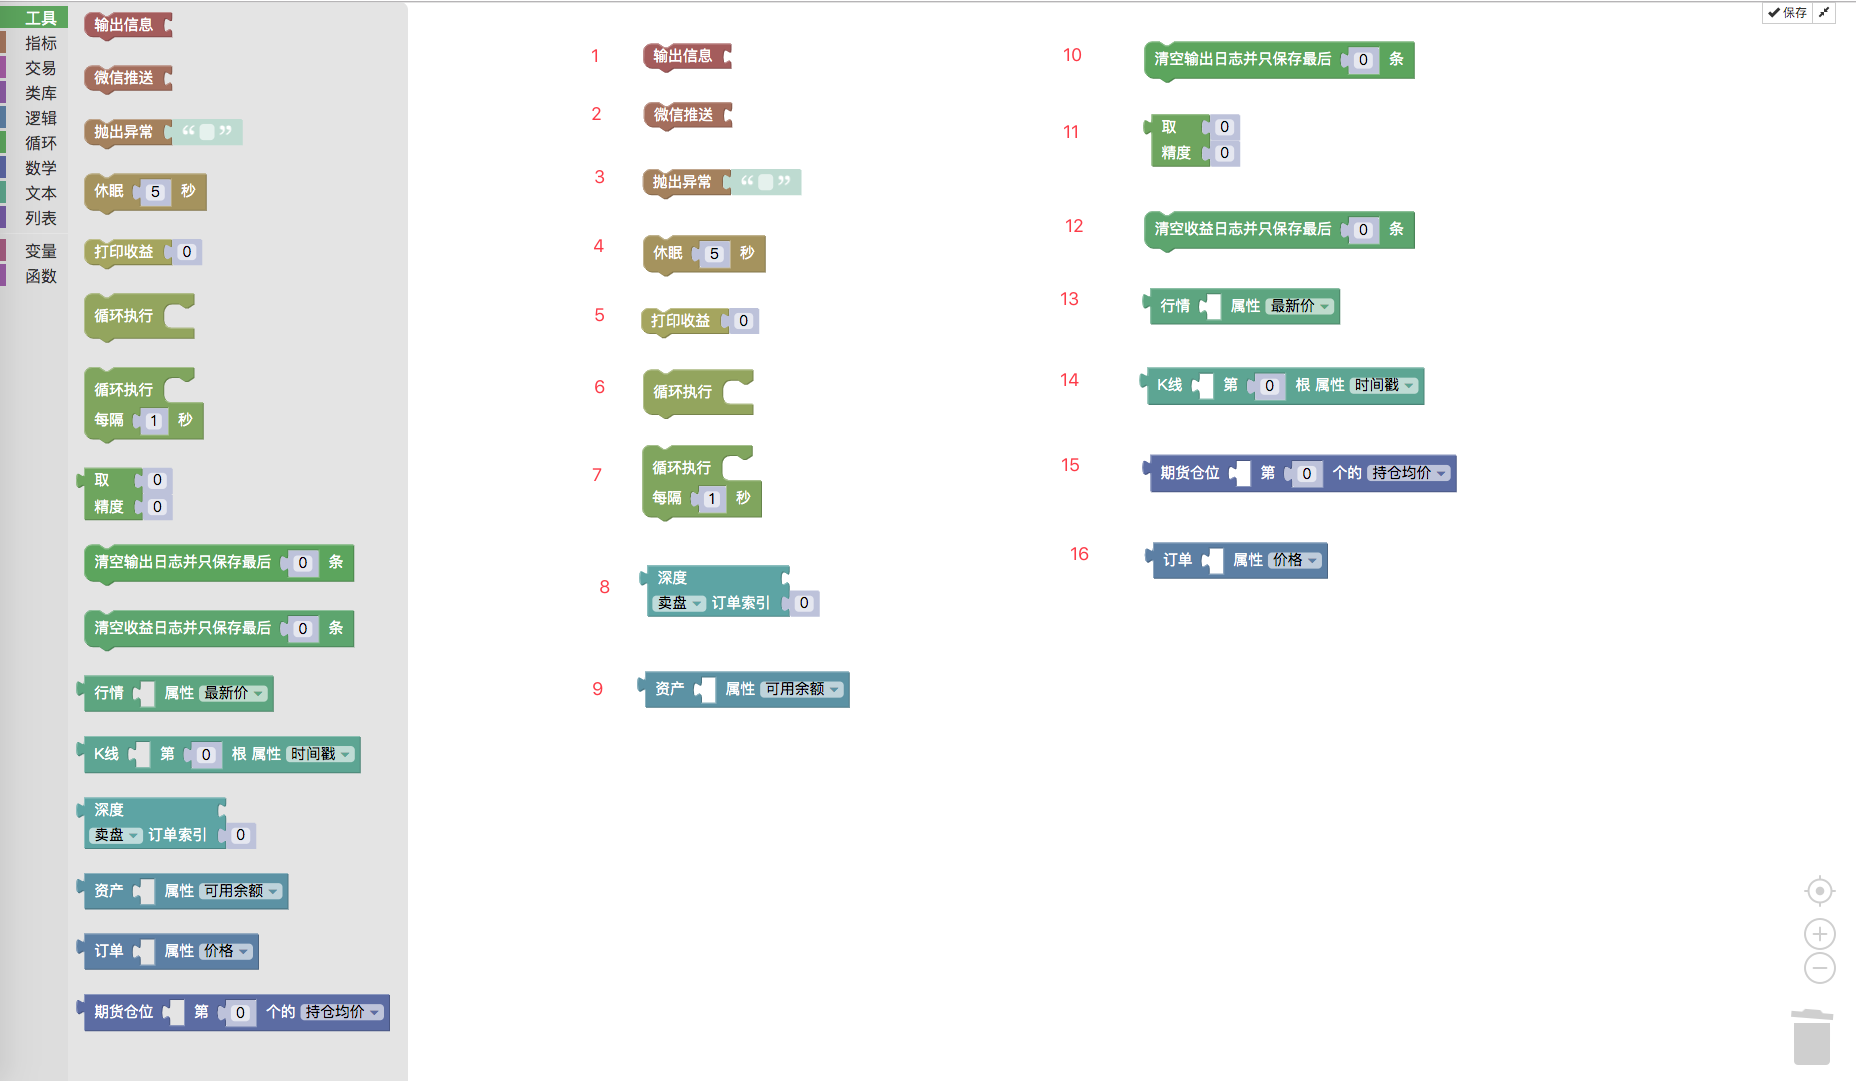
- ### 1, output:
The module is usually used in combination with the text class module, as shown below:
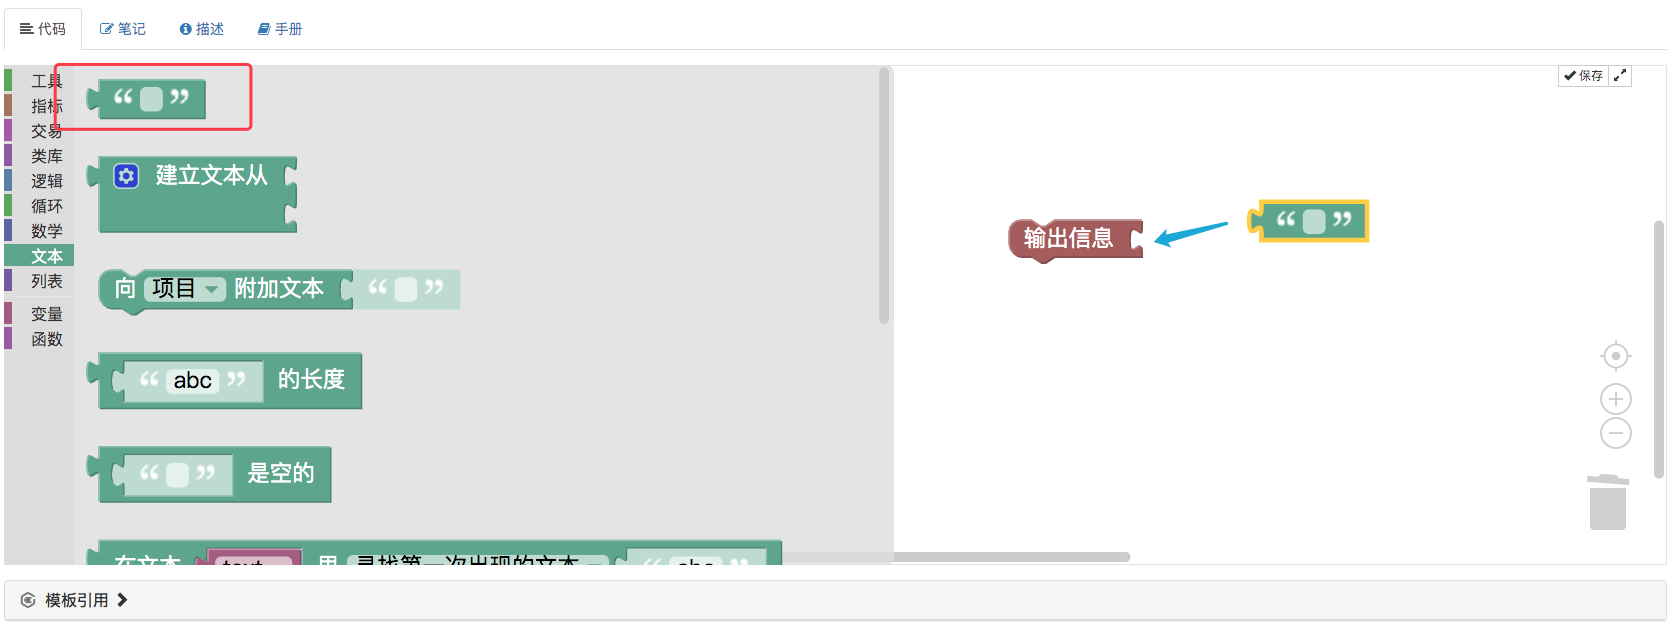 Strings can be entered into the text class module, so that when you run the "Export information" module, the content of the strings in the text module will be printed.
 This is not the first time.
For example, JavaScript language code:
  function main(){
      Log("你好,可视化编程!")
  }
- ###2, WeChat pushed:
The module is similar in appearance to "Export Information", but differs in that it pushes information to WeChat tied to the current account while also exporting information.


For example, JavaScript language code:
  function main () {
      Log("微信推送!@")
  }
- ### 3, throw the exception.
Throwing an exception module causes the program to issue an error, and then the program stops executing (unless you write exception handling code).

Similar to the main function in the JavaScript policy, the throw function directly executes the throw function.
  function main () {
      throw "第一句就抛出异常,让程序停止!"
  }
The results of the tests:
 It is more commonly used during debugging, for example, to stop a program under a certain condition, and some data is easier to observe when printed.
Or throw out an abnormal module in the code process that may cause problems, allowing the program to report errors and find some errors.
- ### Four, sleep
The sleeping module
 The following is the JavaScript policy:
  function main () {
      Sleep(1000 * 5)
  }
The sleep module is tested:
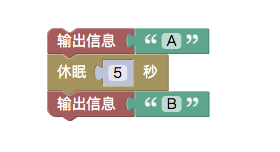 The results of the tests:
- ### 5 Printing earnings

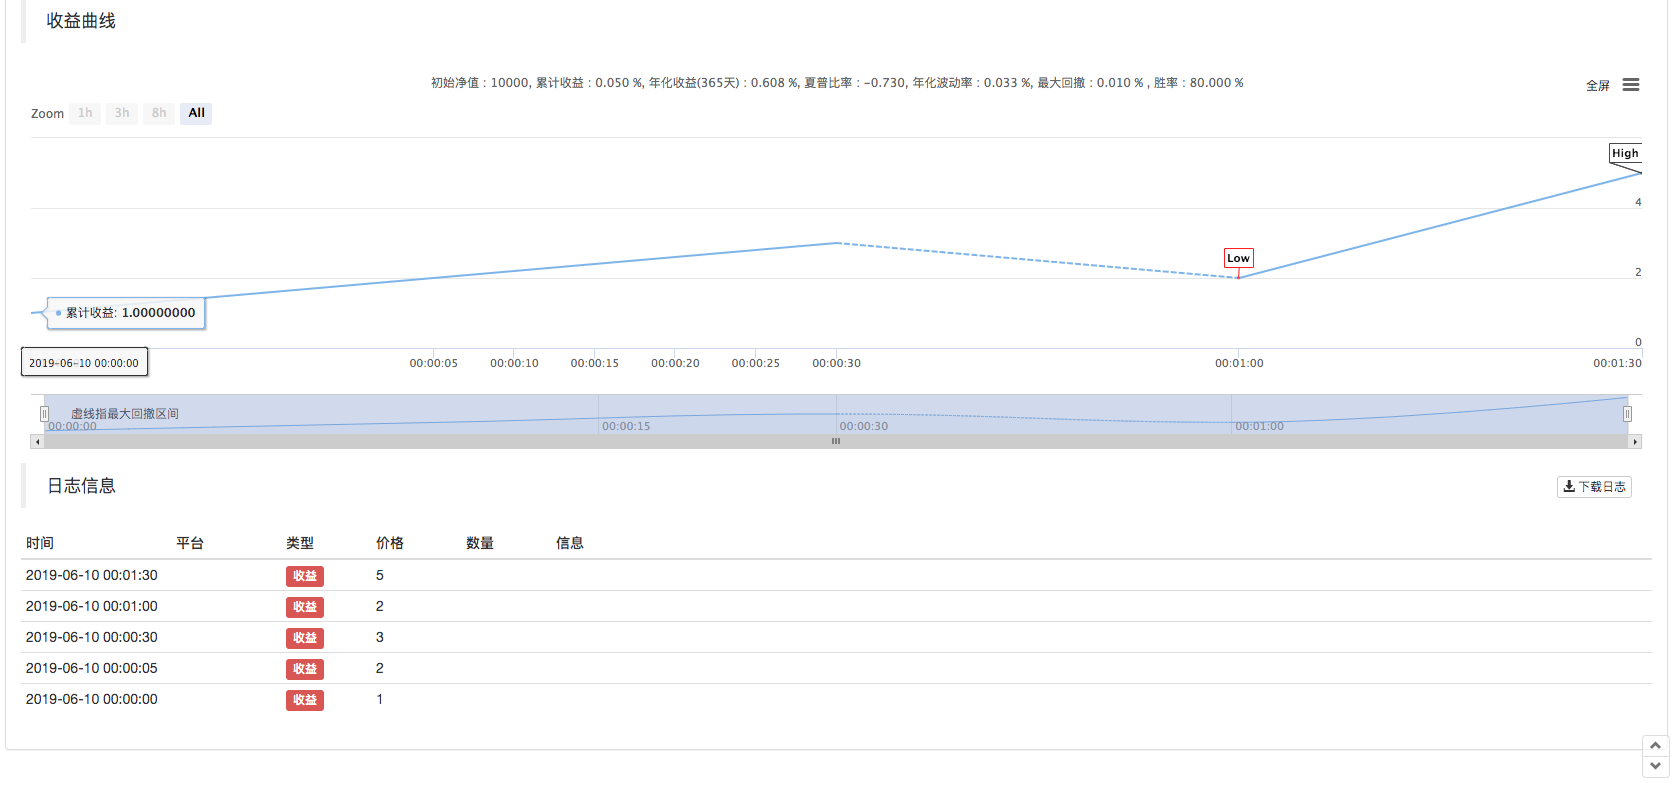
The module, like the inventor quantified trading platform API function LogProfit, prints earnings logs and automatically draws earnings curves based on the input parameters.
For example:
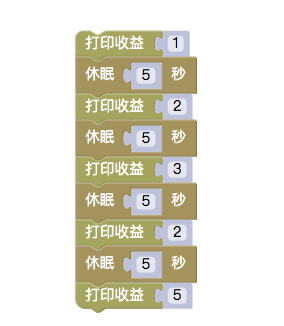 The results of the re-test are as follows:
 The corresponding JavaScript policy code is as follows:
  function main () {
      LogProfit(1)
      Sleep(1000 * 5)
      LogProfit(2)
      Sleep(1000 * 5)
      LogProfit(3)
      Sleep(1000 * 5)
      LogProfit(2)
      Sleep(1000 * 5)
      LogProfit(5)
  }
It can be spelled anywhere you want to export the earnings information.
- ### 6, the cycle
 A loop module can be encapsulated in a series of stacked module combinations, allowing this module combination to execute a loop.
The test:
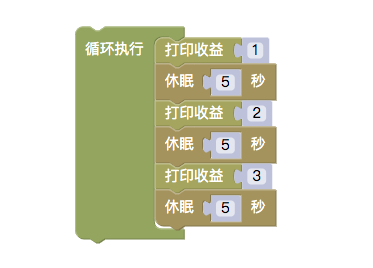 The results of the tests:
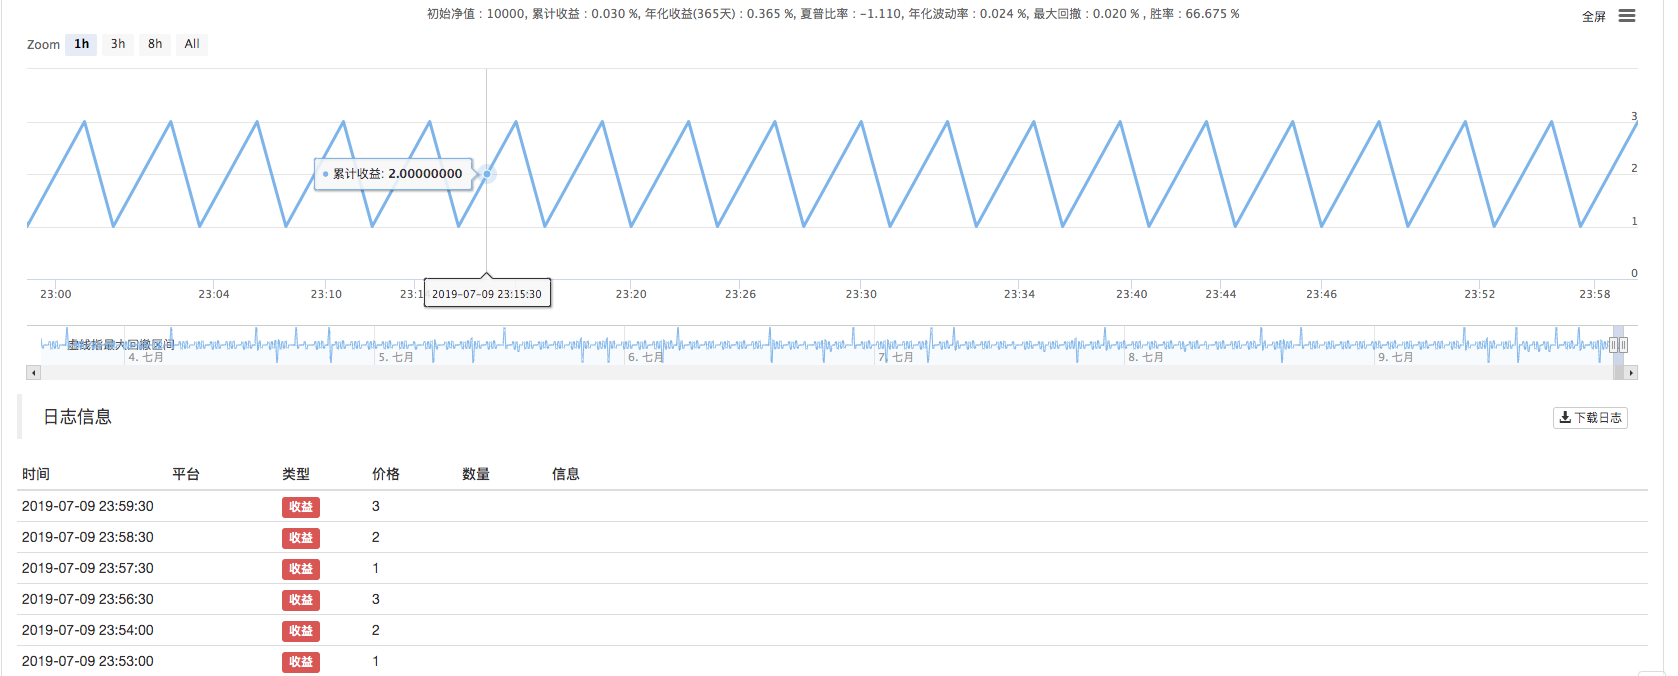 As you can see, after a combination of modules consisting of print gain and sleep, the module combination is executed over and over again.
- ### 7, loop execution every N seconds
 The module is basically the same as the circulating module, the only difference being that the module is self-dormant.
- ### 8, precision processing
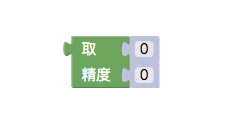 A variable module or a numerical value can be handled with this module when precision control is required. The value of the parameter portion is entered, and the value of the specified decimal digit is output according to the setting.
For example, the value 3.1415926535897 is handled with precision.

The results showed:

- ### 9, empty logs

For blank logs, a part of the log can be kept depending on the input parameters. As in the API documentation:
LogReset()
- ### 10#, empty earnings log

For empty earnings logs, a portion of the logs can be kept depending on the input parameters. As in the API documentation:
LogProfitReset()
The following are some of the most commonly used tool modules.
- ### 11, a functional module to access a property of the market

This tool module needs to be used in conjunction with the industry module in "Trading Module Types", as shown below:
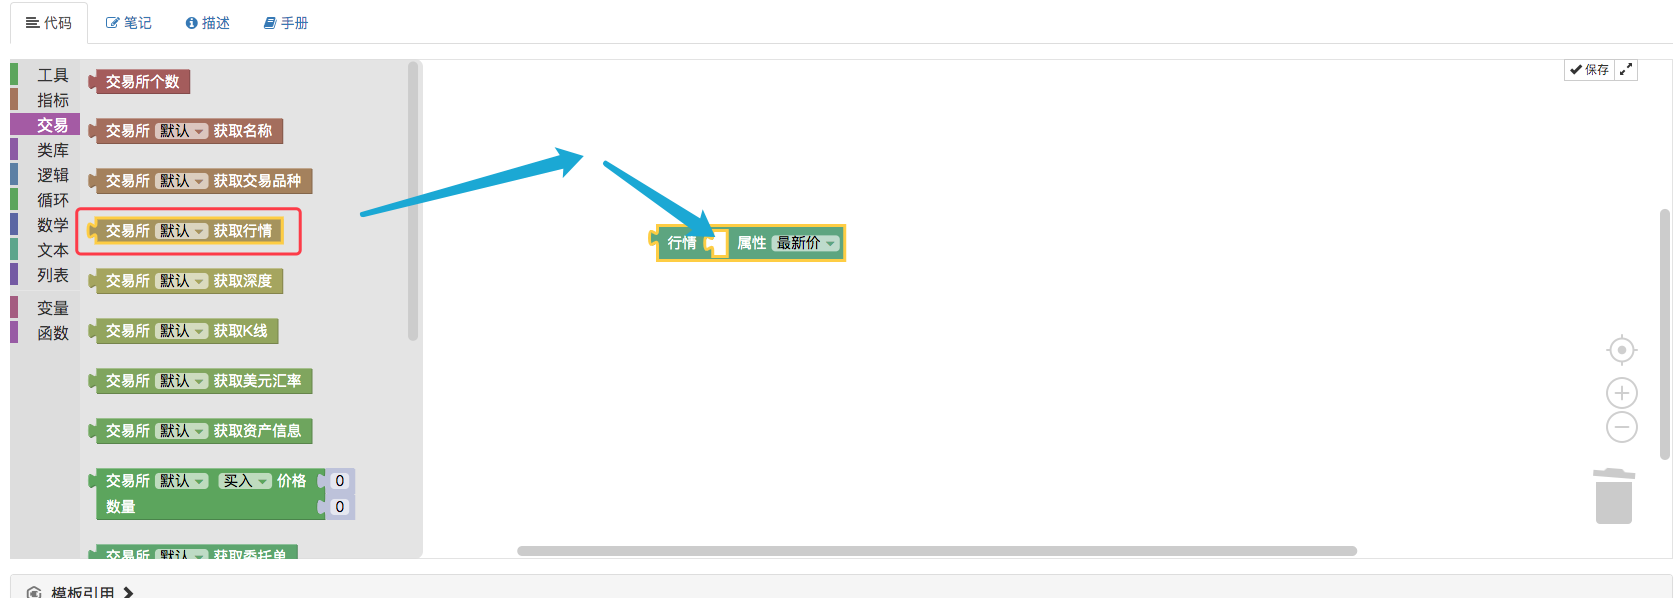
Use the output information module to output the latest ticker transaction price for the following transaction:

The results showed:

For example, JavaScript policy code:
function main () { Log(exchange.GetTicker().Last) }- ### 12, get K-line data from a module on a Bar property

The module also needs to be used with the acquisition K-line data module in the "Transaction Module Type".
The first step is to create a variable module called K-line.
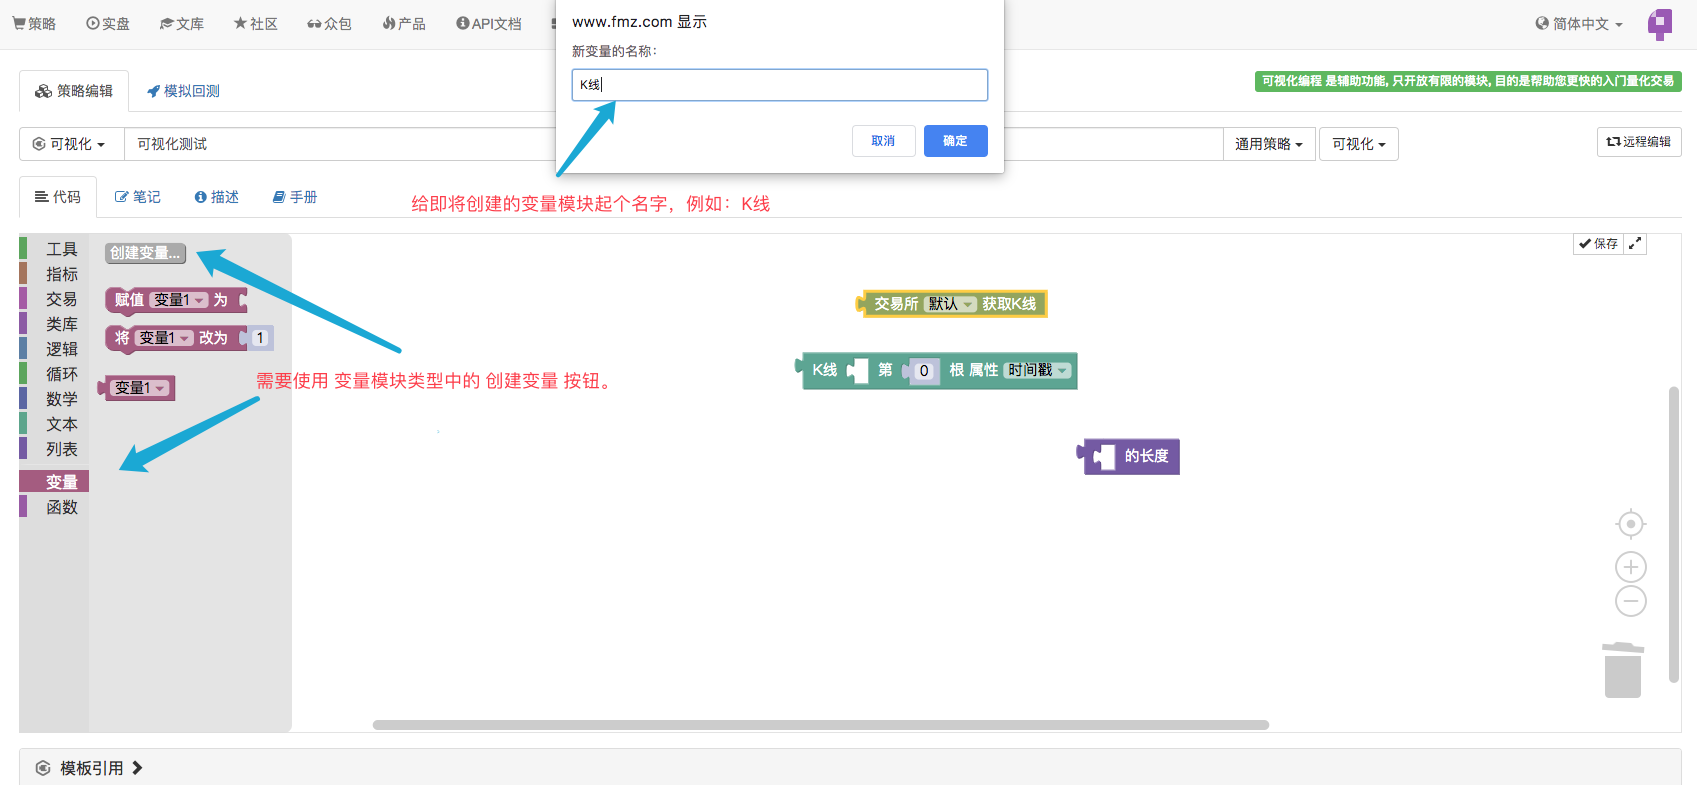 Then, the K-line data is obtained using the K-line data module and assigned a value to the variable module: "K-line".
 Then use the list length module in the "List Module Type" to obtain the length of the variable module in the K-line to specify which Bar of the data in the K-line to obtain.
 It's like the following:
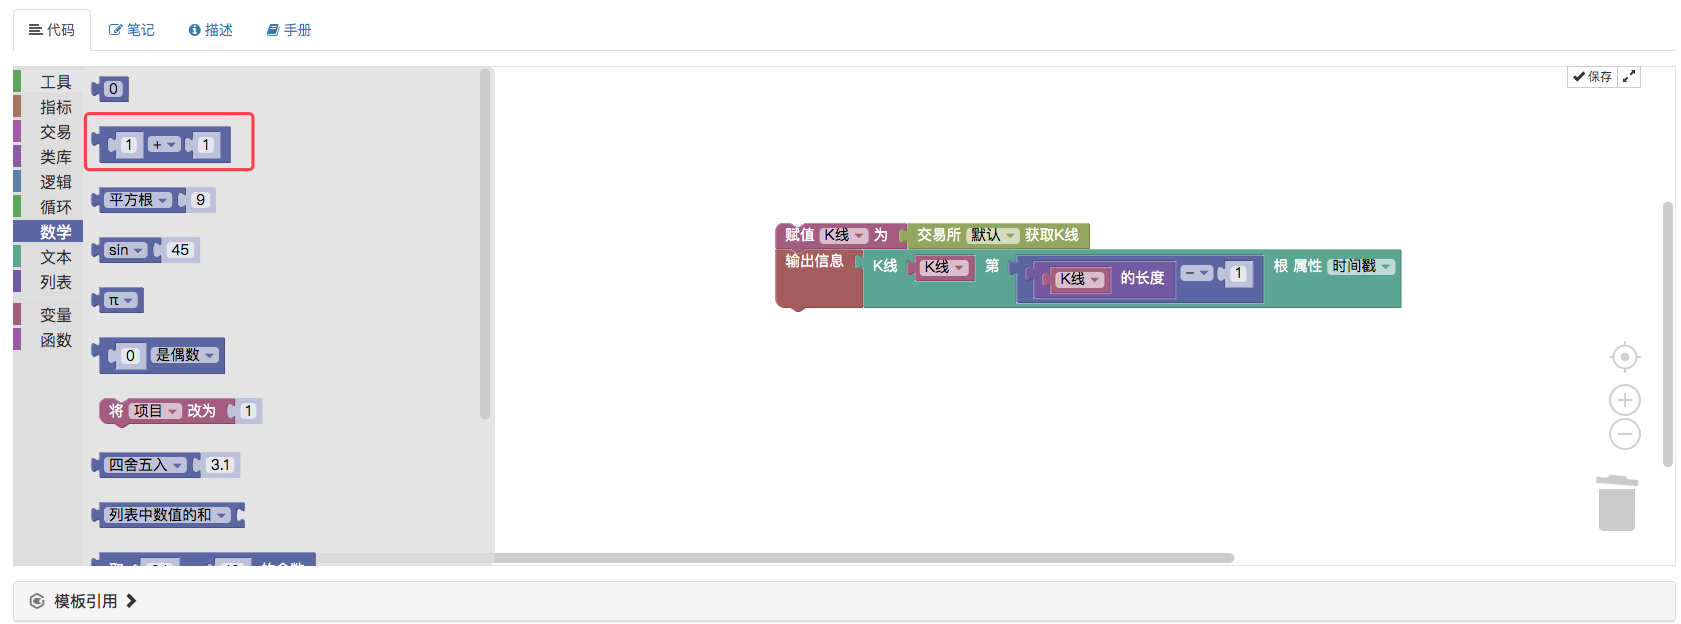 The retest is run, and the last K-line Bar time stamp is printed.
- ###13; Module for obtaining order data from the order sheet

It should also be used in conjunction with the acquisition of deep data modules in the "Transaction Module Type".

The index is set to 0, the order is set to sell, and you get the information about this order.

For example, JavaScript policy code:
function main () { Log(exchange.GetDepth().Asks[0]) }- ### 14, a module for obtaining an attribute from asset information
 The module needs to be used with the asset information module.
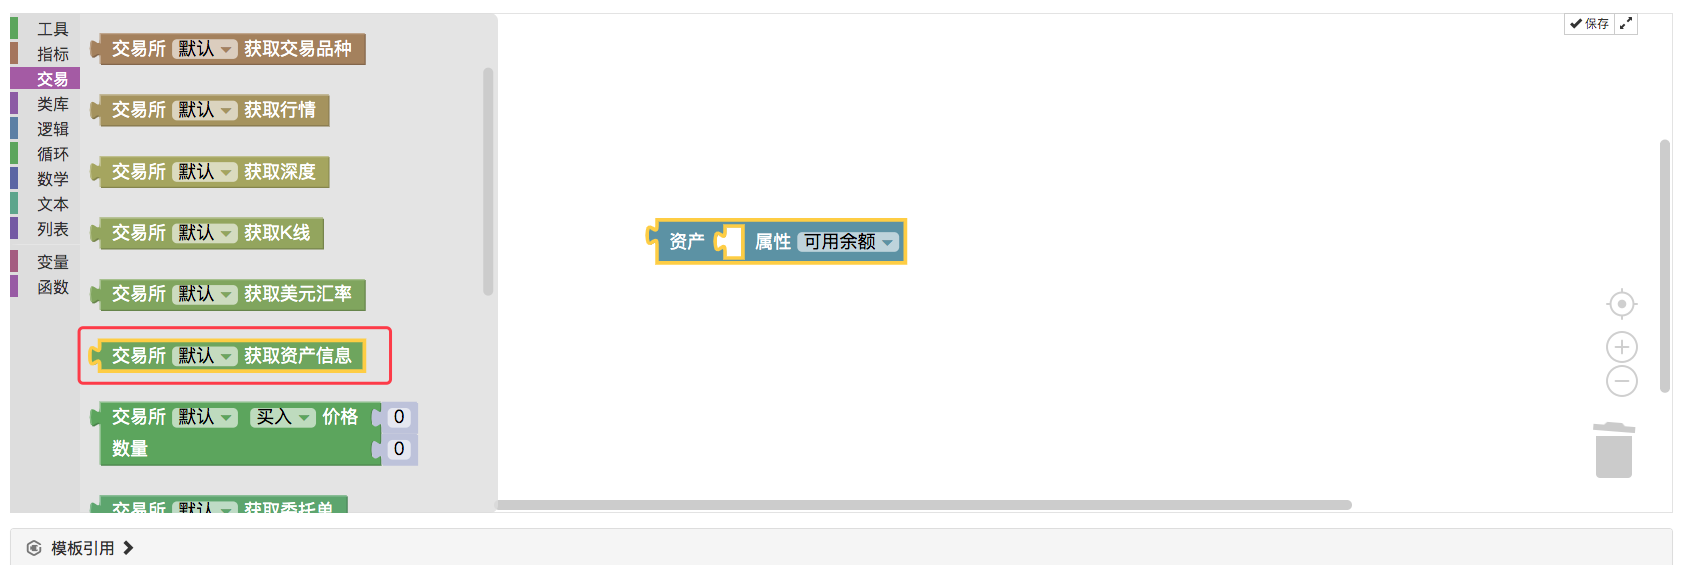
For example, print the number of coins available in the current account

The results showed:

For example, the JavaScript policy:
function main () { Log(exchange.GetAccount().Stocks) }- ### 15 modules for obtaining an attribute from order data

This module is used to retrieve the value of an attribute in the order data, such as the price or quantity of a sale in the order sheet (example of order number 13).

The results of the tests:
 For example, the JavaScript policy:
  function main () {
      Log(exchange.GetDepth().Asks[0].Price)
  }
An attribute in the order information returned by the "Query Order Details Module" can also be used (explained in the next section).
- ### 16, modules of position attributes for a position in the holding information

Similarly, to be used in conjunction with "get futures holdings module", it is important to note that the holdings data returned by get futures holdings module is an array (list), which is a data structure containing different contracts, positions in different directions.
After learning so much, we came together to combine a hedging operation, which is to hedge both short-term and long-term contracts. We do a positive leverage hedge, that is, we open one long-term contract, one more contract in the near term.
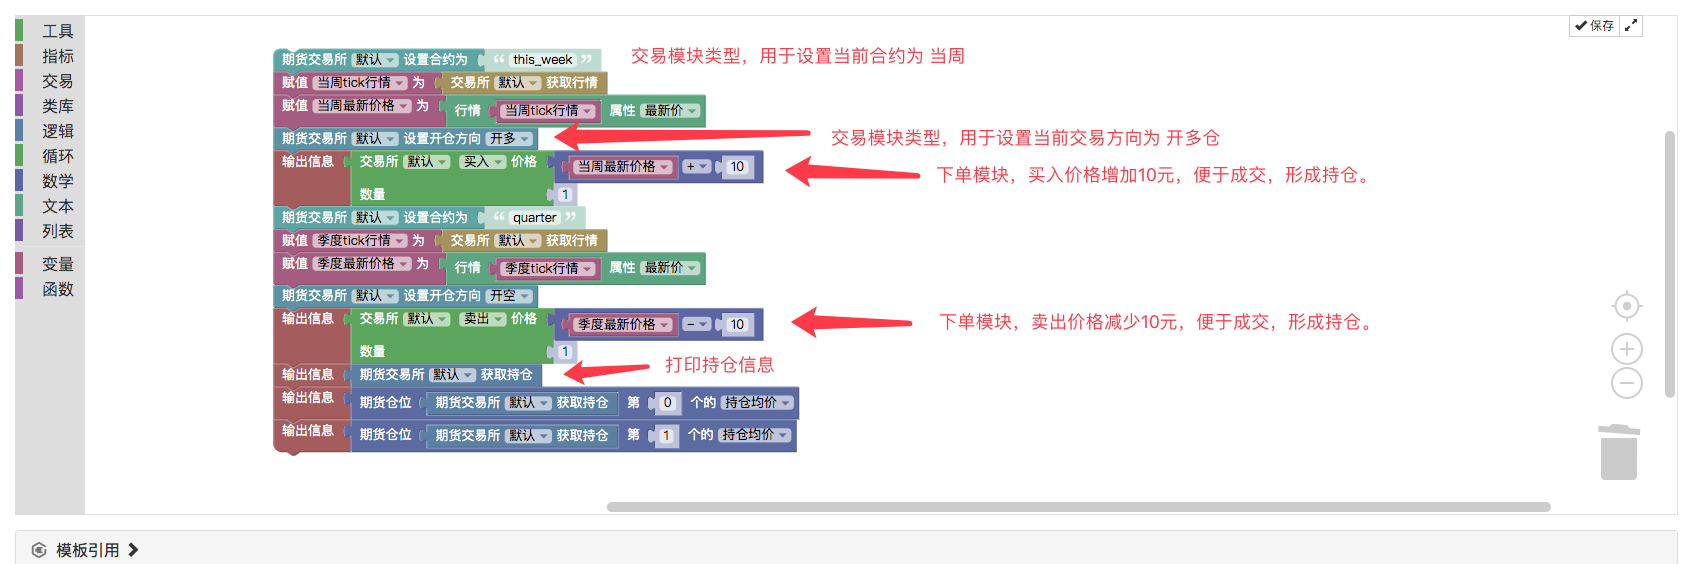
The results of the tests:

Visualizing the paradigm strategy: - What?https://www.fmz.com/strategy/121404 - https://www.fmz.com/strategy/129895 - https://www.fmz.com/strategy/123904 - https://www.fmz.com/strategy/122318
More tips can be found at:https://www.fmz.com/square
Other articles in this series
- Visualization modules build trading strategies in depth
- Visualizing modules to build trading strategies
It's boring programming, it's easy to do with blocks, try it out, it's fun!
- Quantitative Practice of DEX Exchanges (2) -- Hyperliquid User Guide
- DEX exchange quantitative practices ((2) -- Hyperliquid user guide
- Quantitative Practice of DEX Exchanges (1) -- dYdX v4 User Guide
- Introduction to Lead-Lag Arbitrage in Cryptocurrency (3)
- DEX exchange quantitative practice ((1) -- dYdX v4 user guide
- Introduction to the Lead-Lag suite in digital currency (3)
- Introduction to Lead-Lag Arbitrage in Cryptocurrency (2)
- Introduction to the Lead-Lag suite in the digital currency (2)
- Discussion on External Signal Reception of FMZ Platform: A Complete Solution for Receiving Signals with Built-in Http Service in Strategy
- Discussing FMZ platform external signal reception: a complete set of strategies for the reception of signals from built-in HTTP services
- Introduction to Lead-Lag Arbitrage in Cryptocurrency (1)
- Trading strategies based on box theory that support commodity futures and digital currencies
- Thermometer strategies in the practice and application of inventor quantization platforms
- The strategic framework for the indicators
- 6 simple strategies and practices for beginners in quantitative digital currency trading
- Visualizing modules to build trading strategies - progress
- Pivot Point day trading system
- Three potential models in quantitative trading
- RangeBreak strategy combined with real-world use of volatility
- Neural network and digital currency quantitative trading series ((1)
LSTM predicts Bitcoin price - Principles and writing of stop-loss models
- Digital currency adaptive even-line trading system and KAMA algorithm solver based inventor-based quantitative trading software
- FMZ inventors quantify platform feedback
- A simple demonstration of moving averages using the curve.
- Industry giant reveals algorithmic trading: inventors quantify platforms as market strategy
- Calculation and application of DMI indicators
- An intraday trading strategy using the mean value return between SPY and IWM
- Application of technical indicators in quantitative trading
- Use JavaScript to implement a quantification policy while running the Go function in a wrapper.
- 19 professionals share their tips for trading digital currencies
- Shannon's demonic spell applied to digital currency
15650463856There's no cc in the indicator, so I can't create this visualization if I'm going to use cc or not.
Black and white.Please tell me how to use the indicator module in the visualization
Inventors quantify - small dreams https://www.fmz.com/digest-topic/6182
15650463856In addition to in-depth, basic, and advanced, there are three other articles in this series, why haven't I found custom modules and indicator modules to use?
Inventors quantify - small dreamsThis article in this series discusses how to implement custom modules.
Black and white.Good, thank you. Found it.
Inventors quantify - small dreamsThis series of articles can be read and re-told.