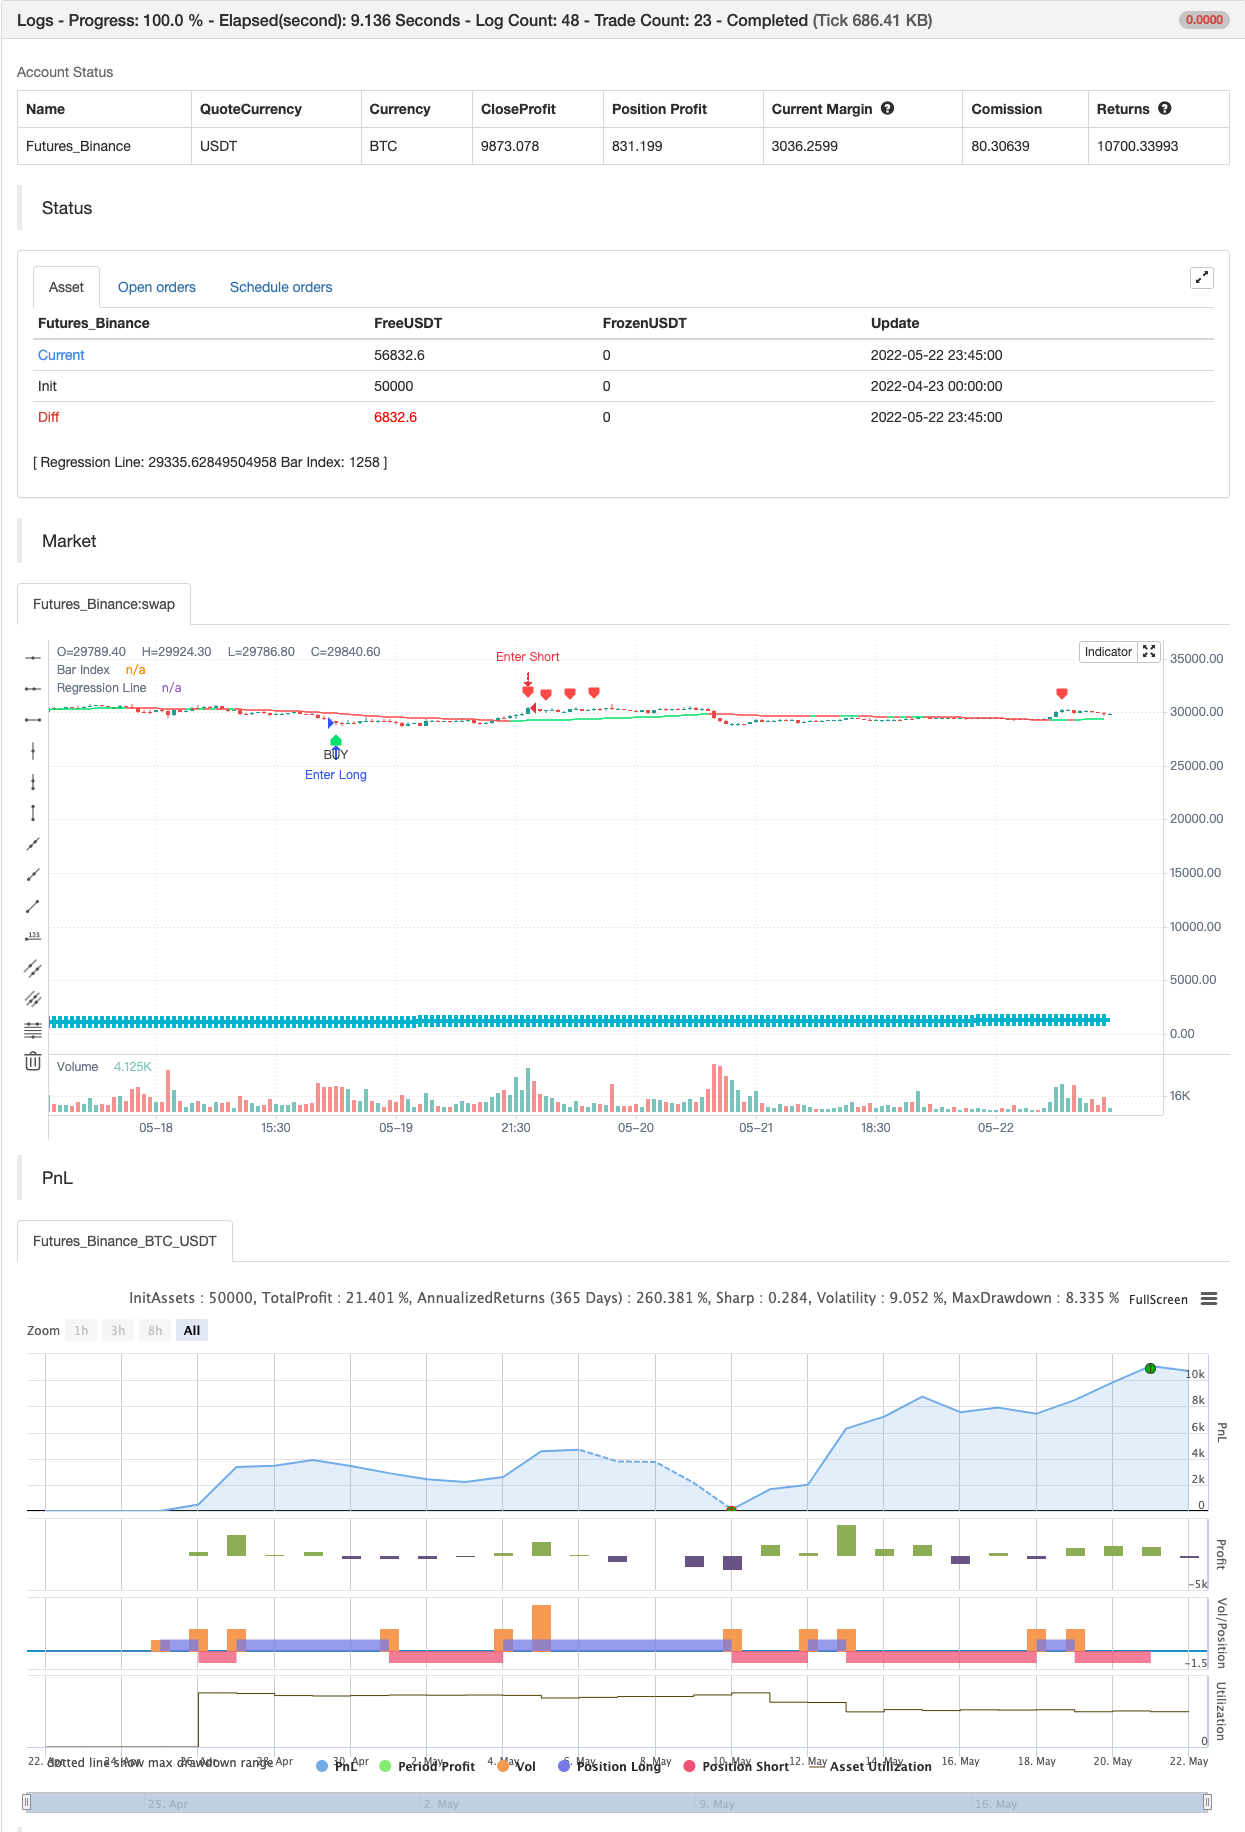
Linear Regression ++
Author: ChaoZhang, Date: 2022-05-24 14:17:42Tags: DEV
ue to public demand
Linear Regression Formula Scraped Calculation With Alerts
Here is the Linear Regression Script For traders Who love rich features
Features ++ Multi time frame -> Source Regression from a different Chart ++ Customized Colors -> This includes the pine lines ++ Smoothing -> Allow Filtered Regression; Note: Using 1 Defaults to the original line. The default is 1 ++ Alerts On Channel/Range Crossing
Usage ++ Use this for BreakOuts and Reversals ++ This Script is not to be used Independently
Risks Please note, this script is the likes of Bollinger bands and poses a risk of falling in a trend range. Signals may Keep running on the same direction while the market is reversing.
Requests If you have any feature requests, comment below or dm me. I will answer when i can. Feel free to utilize this on your chart and share your ideas
For developers who want to use this on their chart, Please use this script The original formula for calculation is posted there
❤❤❤ I hope you love this. From my heart! ❤❤❤
backtest

/*backtest
start: 2022-04-23 00:00:00
end: 2022-05-22 23:59:00
period: 45m
basePeriod: 5m
exchanges: [{"eid":"Futures_Binance","currency":"BTC_USDT"}]
*/

// This source code is subject to the terms of the Mozilla Public License 2.0 at https://mozilla.org/MPL/2.0/
// © LucemAnb
// User Version

//@version=4
study("Linear Regression ++ [Lucem Anb]", "Lin Reg ++ [Lucem Anb]", overlay=true)


source      = input(close)
length      = input(100, minval=1)
offset      = input(0, minval=0)
dev         = input(2.0, "Deviation")
smoothing   = input(1, minval=1)
mtf_val     = input("", "Resolution", input.resolution)
line_thick  = input(4, "S&R Thickness", minval=1, maxval=4)
signals     = input("Recent", "Signals Display", options=["Recent", "All"])
p           = input("Lime", "Up Color", options=["Red", "Lime", "Orange", "Teal", "Yellow", "White", "Black"])
q           = input("Red", "Down Color", options=["Red", "Lime", "Orange", "Teal", "Yellow", "White", "Black"])
goto        = input(0, "End At Bar Index")

cc(x) => x=="Red"?color.red:x=="Lime"?color.lime:x=="Orange"?color.orange:x=="Teal"?
 color.teal:x=="Yellow"?color.yellow:x=="Black"?color.black:color.white
data(x) => sma(security(syminfo.tickerid, mtf_val!="" ? mtf_val : timeframe.period, x), smoothing)

linreg = data(linreg(source, length, offset))
linreg_p = data(linreg(source, length, offset+1))
plot(linreg, "Regression Line", cc(linreg>linreg[1]?p:q), editable=false)

x = bar_index
slope = linreg - linreg_p
intercept = linreg - x*slope
deviationSum = 0.0
for i=0 to length-1
    deviationSum:= deviationSum + pow(source[i]-(slope*(x-i)+intercept), 2)
deviation = sqrt(deviationSum/(length))
x1 = x-length
x2 = x
y1 = slope*(x-length)+intercept
y2 = linreg

updating = goto <= 0 or x < goto


dm_current = -deviation*dev + y2
dp_current = deviation*dev + y2
buy = crossunder(close, dm_current)
sell = crossover(close, dp_current)
alertcondition(buy, "Buy Lin Reg", "Crossing On the Lower Regression Channel")
alertcondition(sell, "Sell Lin Reg", "Crossing On the Higher Regression Channel")

plotshape(buy, "BUY", shape.labelup, location.belowbar, color.lime, text='BUY', textcolor=color.black, show_last=signals=="All"?99999999:length)
plotshape(sell, "SELL", shape.labeldown, location.abovebar, color.red, text='SELL', textcolor=color.white, show_last=signals=="All"?99999999:length)

plot(x, "Bar Index", color.aqua, line_thick, plot.style_cross, display=display.none)

if buy
    strategy.entry("Enter Long", strategy.long)
else if sell
    strategy.entry("Enter Short", strategy.short)
- Mean Reversion Strategy
- Standard Deviation DEV Trading Strategy Based on Relative Strength Index RSI and Simple Moving Average SMA
- Peak detector
- Super trend B
- Scalping Swing Trading Tool R1-4
- BEST Engulfing + Breakout Strategy
- Bollinger Awesome Alert R1
- Plugins for multiple exchanges
- Triangle leverage (earning a small currency's market price difference)
- bybit reverse contract dynamic grids (specific grids)
- TradingView Alerts to MT4 MT5 + dynamic variables NON-REPAINTING
- Matrix Series
- Super Scalper - 5 Min 15 Min
- Relative Strength Index - Divergences - Libertus
- RedK Dual VADER with Energy Bars
- Consolidation Zones - Live
- Quantitative Qualitative Estimation
- Moving Average Cross Alert, Multi-Timeframe (MTF)
- MACD ReLoaded STRATEGY
- SuperTrended Moving Averages
- Trading ABC
- 15MIN BTCUSDTPERP BOT
- Shannon Entropy V2
- SUPERTREND ATR WITH TRAILING STOP LOSS