概述
该策略基于均值回归的原理,利用价格偏离移动平均线的情况来进行交易决策。当价格向上偏离上轨时做空,向下偏离下轨时做多,价格回归到移动平均线时平仓。这个策略的核心是假设价格总是会回归到均值水平。
策略原理
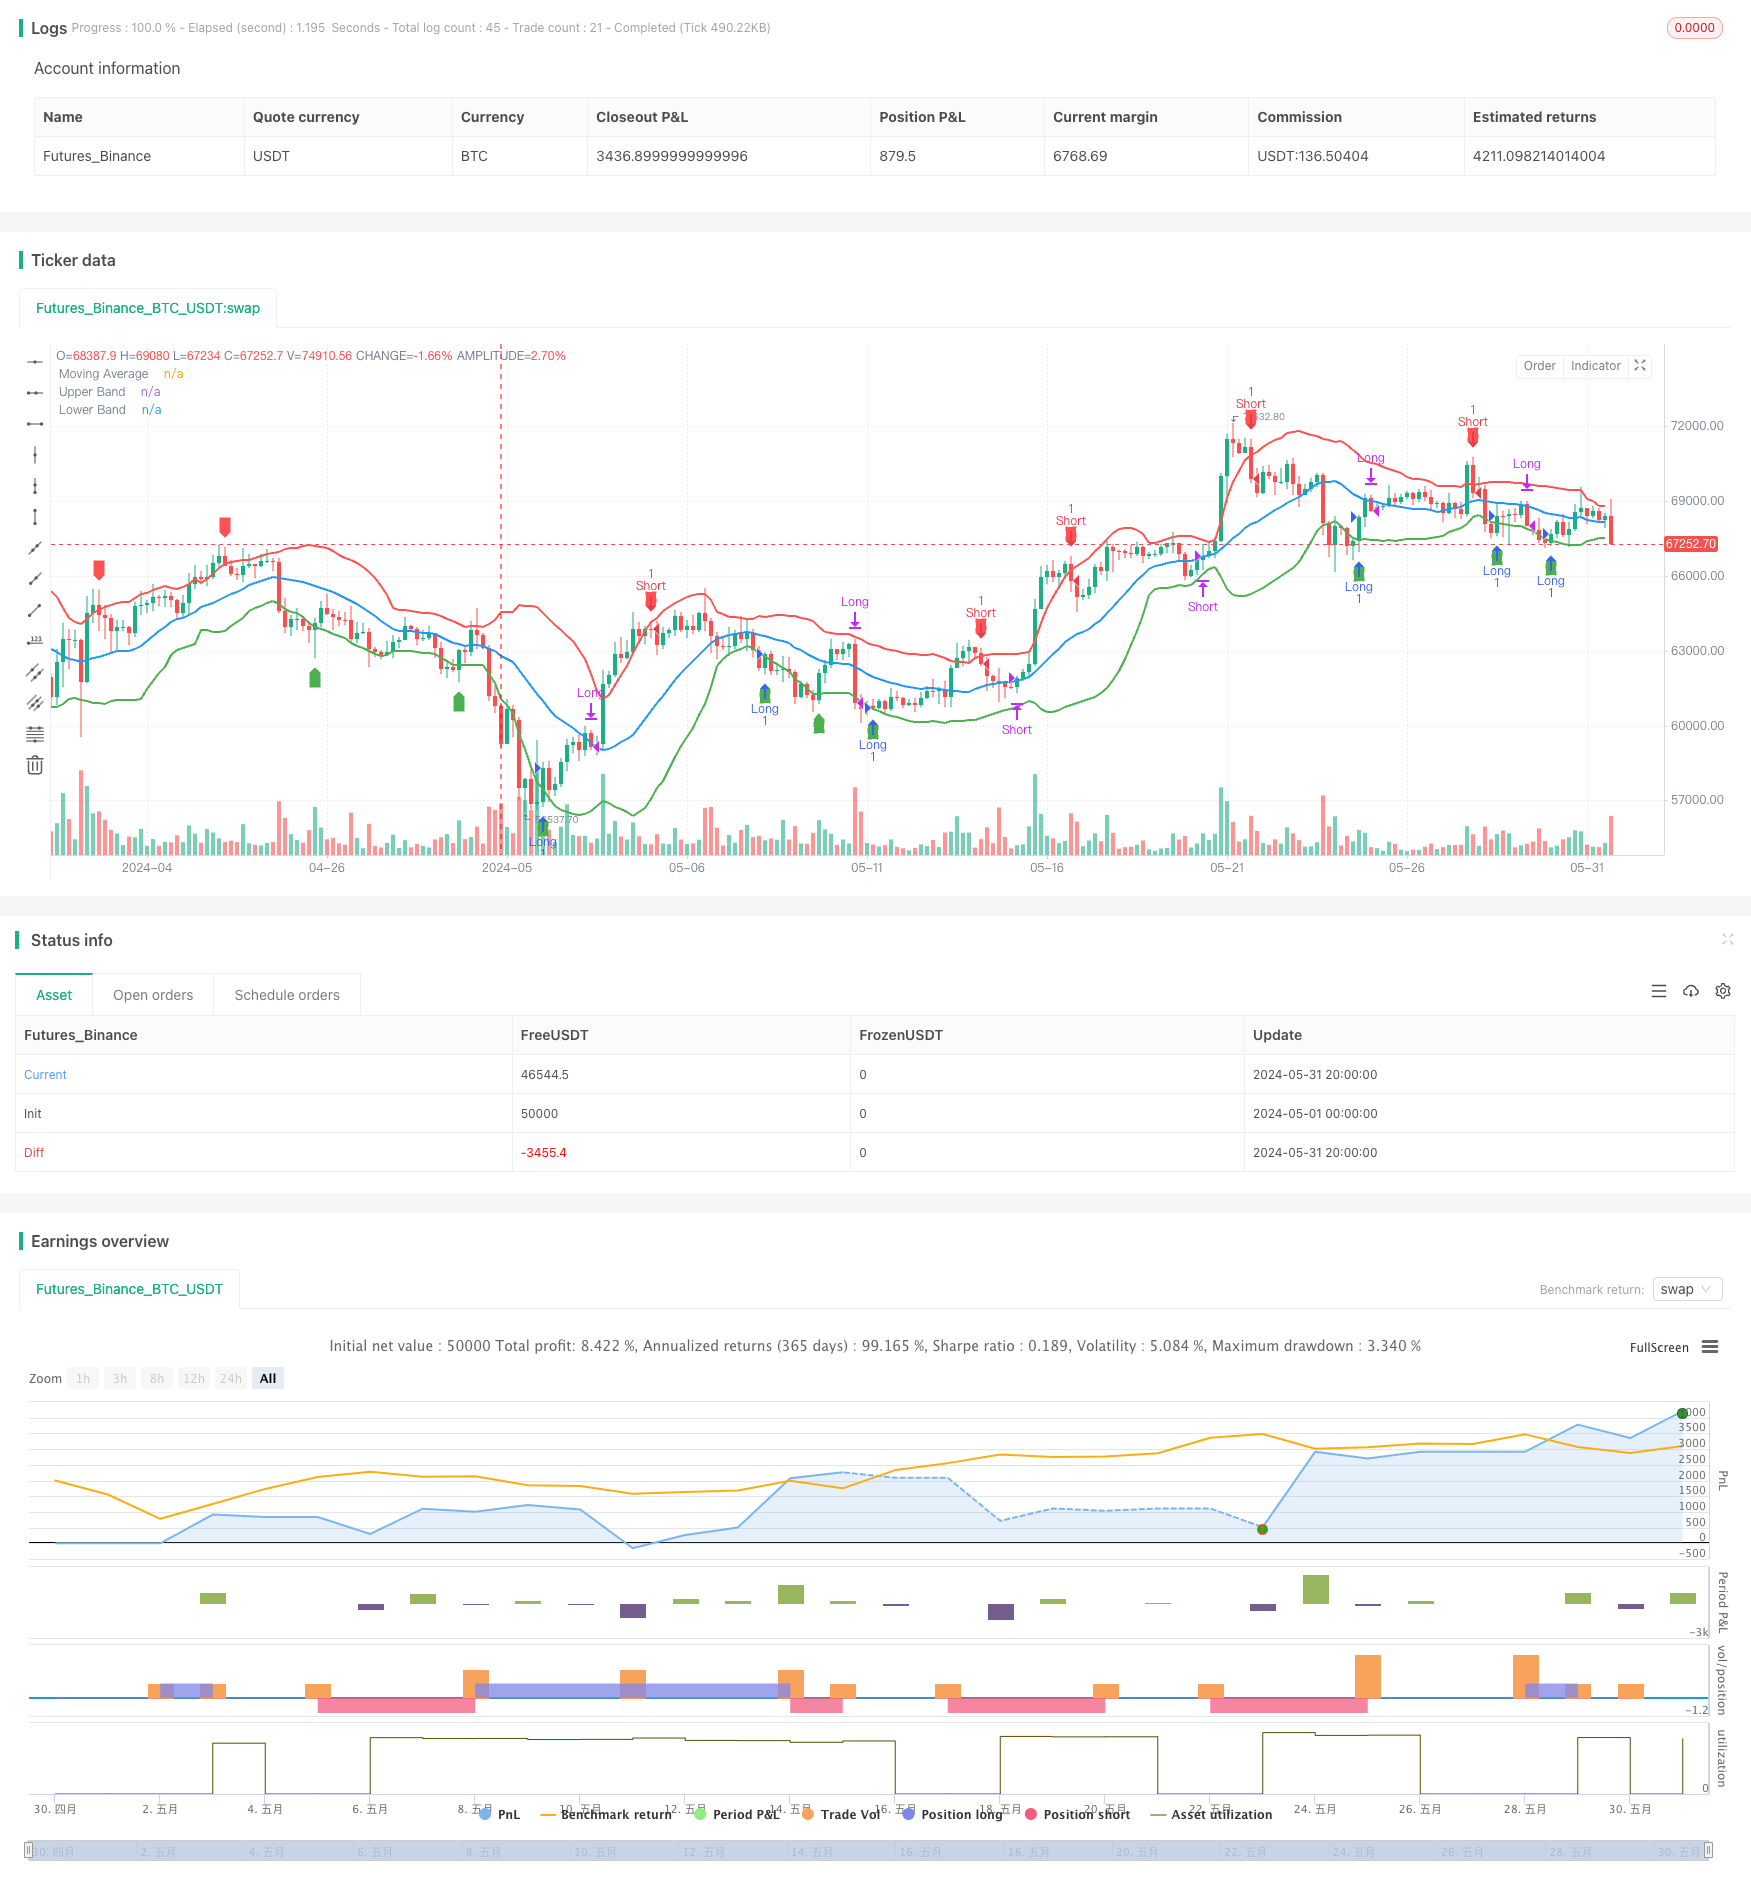
- 计算指定周期(默认20)的简单移动平均线(SMA)作为价格的均值水平。
- 计算价格的标准差(DEV),并以此构建上下轨道。上轨是SMA加上标准差的倍数(默认1.5),下轨是SMA减去标准差的倍数。
- 当价格向上突破上轨时做空,向下突破下轨时做多。
- 当做多的价格向下穿过SMA时平多,做空的价格向上穿过SMA时平空。
- 在图表上标记移动平均线、上轨、下轨以及买卖信号。
优势分析
- 均值回归策略基于价格总是回归均值的统计学原理,长期而言有一定的盈利概率。
- 上下轨的设置提供了明确的入场和出场点位,便于执行和管理。
- 策略逻辑简单清晰,容易理解和实现。
- 适用于存在明显均值回归特征的品种和周期。
风险分析
- 市场趋势发生变化时,价格可能长期偏离均值而不回归,导致策略失效。
- 标准差倍数设置不当会导致交易频率过高或过低,影响收益。
- 极端行情下价格波动剧烈,上下轨可能失去作用。
- 如果品种或周期不存在均值回归的特征,该策略可能无法盈利。
优化方向
- 对SMA的周期和标准差倍数进行优化测试,找到最佳参数。
- 引入趋势判断指标,在趋势明确时避免逆势交易。
- 在标准差之外加入ATR等波动率指标,构建动态轨道。
- 对滑点、手续费等交易成本进行考虑,控制回测的真实性。
- 加入风控模块,如止损止盈、仓位管理等。
总结
均值回归策略是一种基于统计学原理的量化交易策略,通过构建价格均值上下轨来进行交易决策。该策略逻辑简单,执行明确,但要注意品种的选择和参数的优化。在实际应用中,还需要考虑趋势、交易成本、风险控制等因素,以提高策略的稳健性和盈利能力。总之,均值回归策略是量化交易领域一种常见且值得深入研究的策略。
策略源码
/*backtest
start: 2024-05-01 00:00:00
end: 2024-05-31 23:59:59
period: 4h
basePeriod: 15m
exchanges: [{"eid":"Futures_Binance","currency":"BTC_USDT"}]
*/

//@version=5
strategy("Mean Regression Strategy", overlay=true)

// Define the lookback period for the moving average
length = input.int(20, title="Moving Average Length")
mult = input.float(1.5, title="Standard Deviation Multiplier")

// Calculate the moving average and standard deviation
ma = ta.sma(close, length)
dev = mult * ta.stdev(close, length)

// Calculate upper and lower bands
upper_band = ma + dev
lower_band = ma - dev

// Plot the moving average and bands
plot(ma, color=color.blue, linewidth=2, title="Moving Average")
plot(upper_band, color=color.red, linewidth=2, title="Upper Band")
plot(lower_band, color=color.green, linewidth=2, title="Lower Band")

// Entry conditions
long_condition = ta.crossover(close, lower_band)
short_condition = ta.crossunder(close, upper_band)

// Exit conditions
exit_long_condition = ta.crossunder(close, ma)
exit_short_condition = ta.crossover(close, ma)

// Strategy orders
if (long_condition)
    strategy.entry("Long", strategy.long)
if (short_condition)
    strategy.entry("Short", strategy.short)

if (exit_long_condition)
    strategy.close("Long")
if (exit_short_condition)
    strategy.close("Short")

// Plot signals on the chart
plotshape(series=long_condition, location=location.belowbar, color=color.green, style=shape.labelup, title="Buy Signal")
plotshape(series=short_condition, location=location.abovebar, color=color.red, style=shape.labeldown, title="Sell Signal")
相关推荐