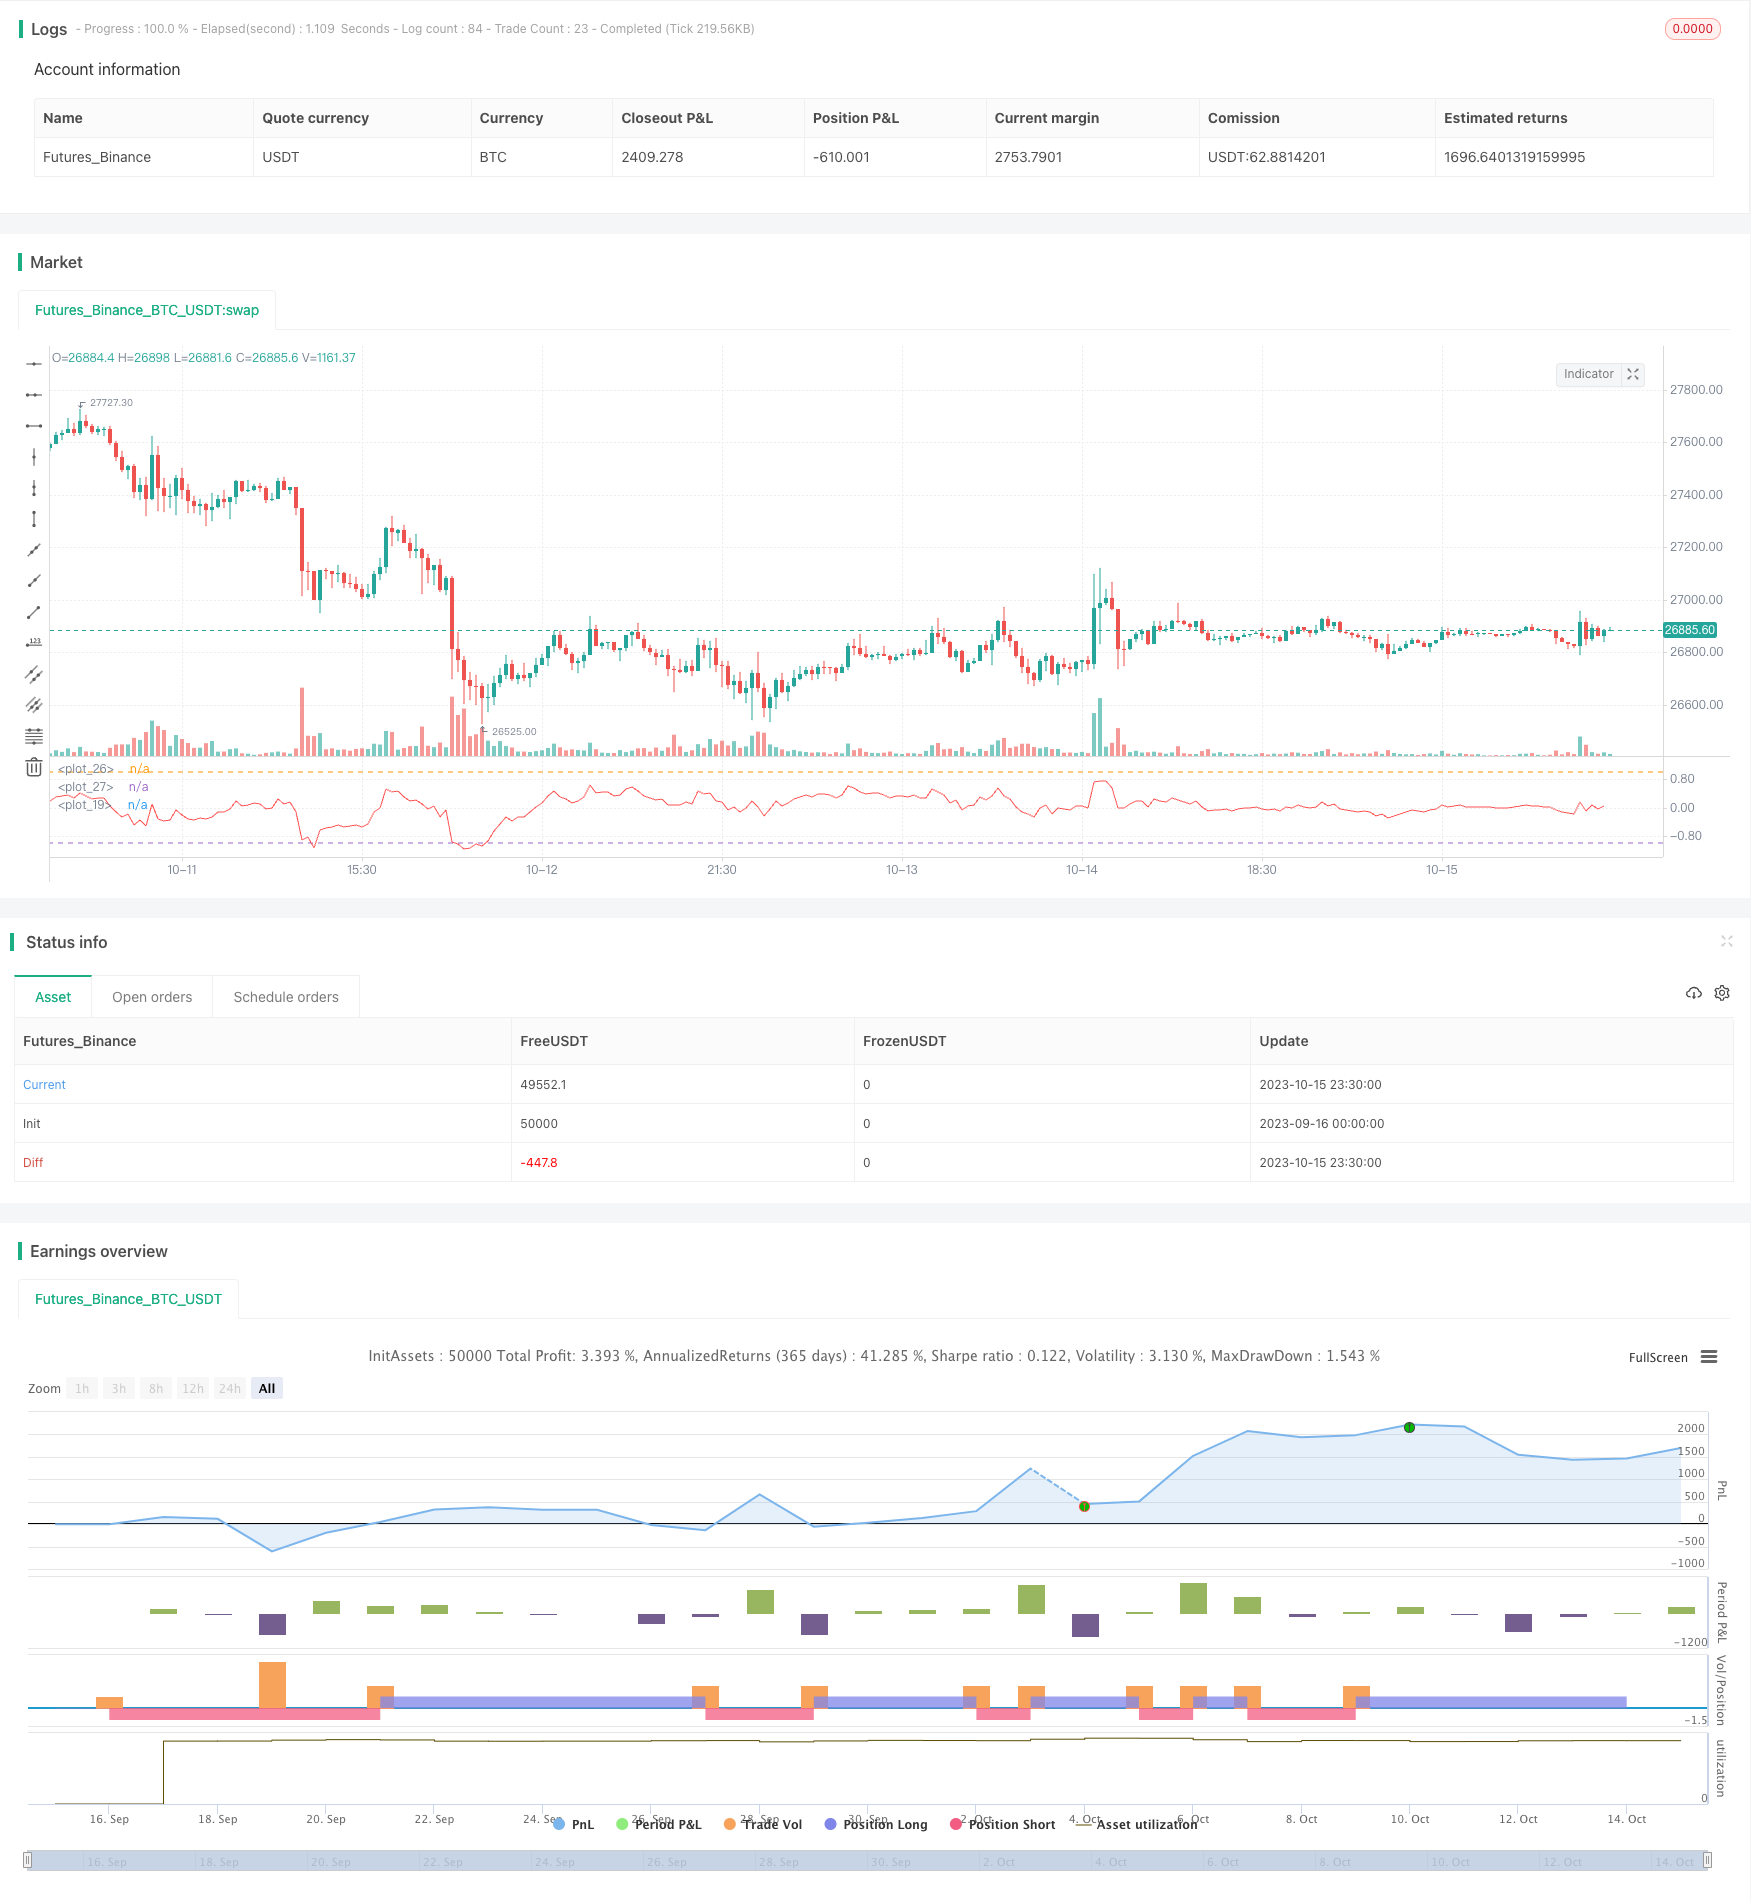
Overview
The DEMA trend following strategy is designed based on the DEMA indicator. It generates buy signals when the price breaks through the lower band of the DEMA and sell signals when the price breaks through the upper band. This strategy belongs to the trend following system.
Strategy Logic
This strategy uses the DEMA indicator to determine the price trend. DEMA is the Double Exponential Moving Average, which is calculated with two EMA lines and can capture price changes faster. The strategy calculates the percentage difference between the price and DEMA, and then generates trading signals.
When the percentage difference crosses above the buyper parameter, a buy signal is generated. When the percentage difference crosses below the sellper parameter, a sell signal is generated. The buyper and sellper parameters represent the strength to generate signals, which can be adjusted based on market conditions.
In addition, the strategy also sets date ranges as filter conditions. Trading signals are only generated within the specified date range.
Advantage Analysis
- Using DEMA can capture price changes more sensitively and identify trend reversals in a timely manner.
- Compared with SMA, DEMA has lower lagging.
- Setting buy/sell strength parameters can control the trading frequency.
- Adding date filters can optimize for seasonal patterns.
- Overall, the parameter settings are reasonable and can be optimized for different market environments.
Risk Analysis
- DEMA itself has some lagging effect and may miss short-term trend reversals.
- There is certain lag in signal generation, entry timing is not precise.
- The strategy relies solely on DEMA without other indicators to verify the signal reliability.
- No stop loss is set, which can lead to large losses.
Risks can be mitigated by combining other indicators for signal verification, optimizing parameters, and adding stop loss.
Optimization Directions
- Consider adding MA indicators for signal filtering, utilizing the trending quality of MA.
- Test the impact of different parameters on return to find the optimal parameter combination.
- Add stop loss strategies with reasonable stop loss percentage to control per trade loss.
- Test the strategy on different stocks to optimize the stock pool.
- Try various exit strategies like trend reversal, breakout etc.
Conclusion
The DEMA trend following strategy is reasonably designed with stable profitability. It successfully uses the DEMA indicator to determine trend direction and works well on various stocks and medium-to-long-term timeframes. Further improvements on parameters, additional indicators, stop loss can enhance return and risk control. This strategy has practical value for live trading but needs continuous testing and optimization for long-term stability.
/*backtest
start: 2023-09-16 00:00:00
end: 2023-10-16 00:00:00
period: 30m
basePeriod: 15m
exchanges: [{"eid":"Futures_Binance","currency":"BTC_USDT"}]
*/

//@version= 2
strategy("DEMA PRICE DİFFERENCE Strategy ",shorttitle="DPD% STR " ,overlay=false)

buyper =input(-1)
sellper=input(1)

demalen = input(50,title="Dema Length")

e1= ema(close,demalen)
e2=ema(e1,demalen)
demaprice  =   2 * e1 - e2

price=close

demadifper =  ((price-demaprice)/price)*100


plot(demadifper, color=red)
OverDemaPer = input(1, title="Band for OverBought")
UnderDemaPer= input(-1,title="Band for OverSold")


band1 = hline(OverDemaPer)
band0 = hline(UnderDemaPer)
zeroline=0
fill(band1, band0, color=green, transp=90)


yearfrom = input(2018)
yearuntil =input(2019)
monthfrom =input(6)
monthuntil =input(12)
dayfrom=input(1)
dayuntil=input(31)


if (  crossover(demadifper,buyper))
    strategy.entry("BUY", strategy.long, stop=close, oca_name="TREND",  comment="BUY")

else
    strategy.cancel(id="BUY")


if ( crossunder(demadifper,sellper)  )

    strategy.entry("SELL", strategy.short,stop=close, oca_name="TREND",  comment="SELL")
else
    strategy.cancel(id="SELL")