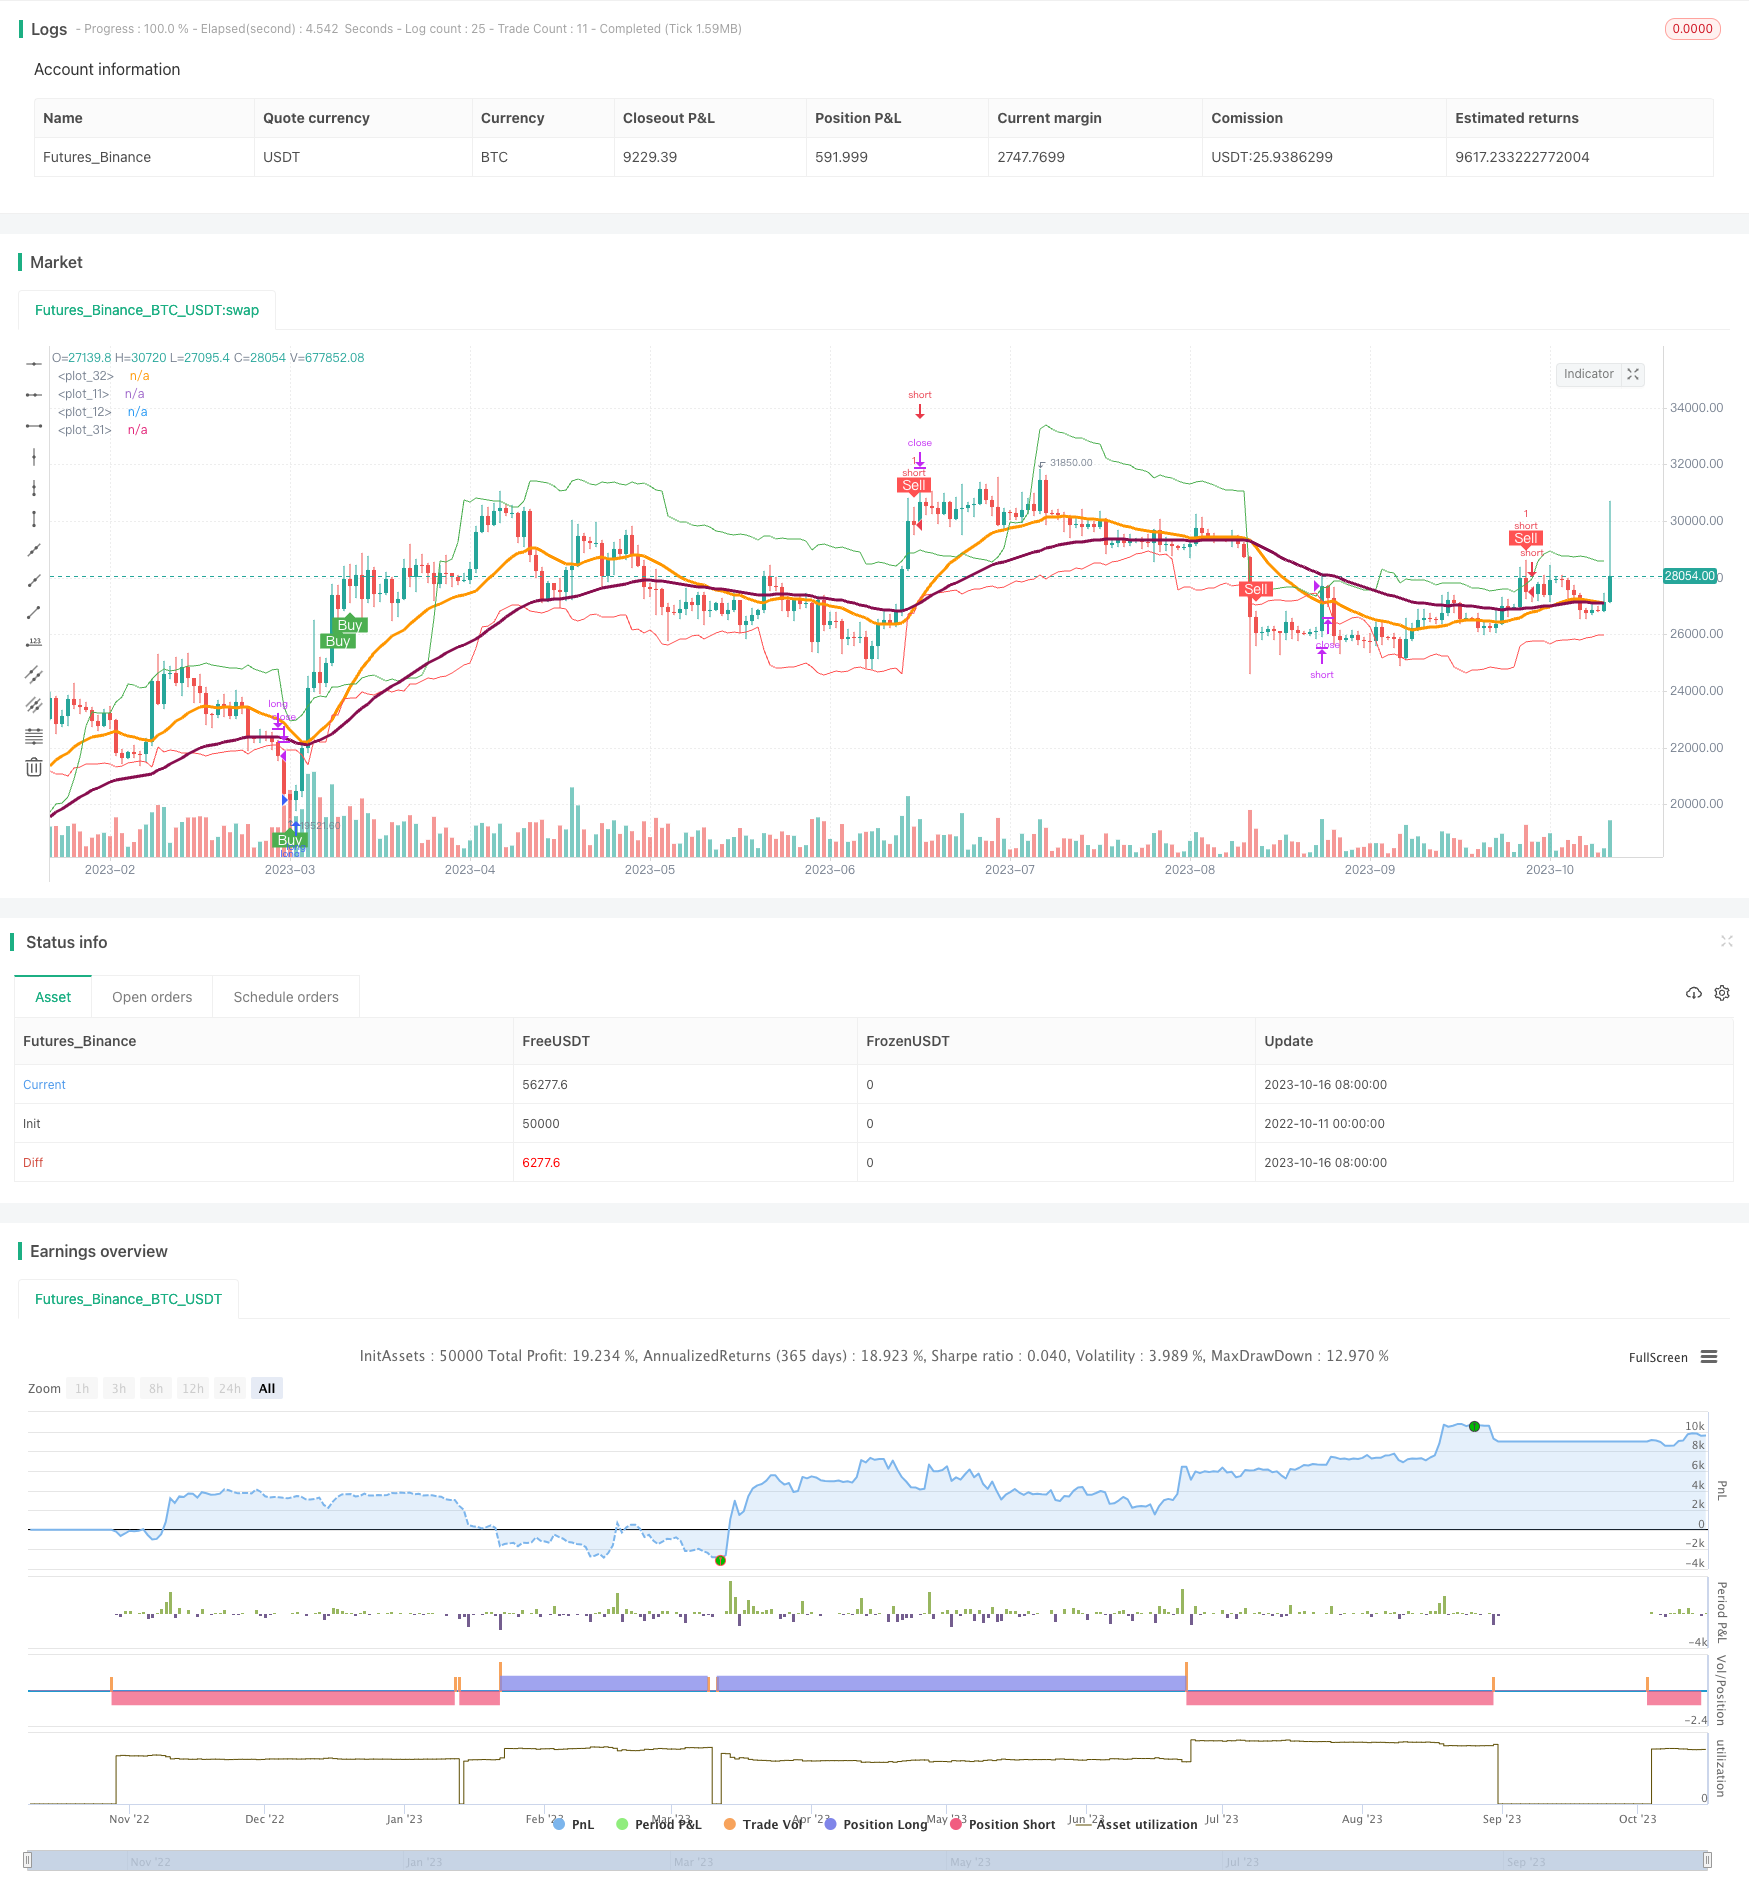
Overview
This strategy uses a moving average system to determine trend direction and combines volatility index to avoid low volatility oscillating markets, with chandelier exit to manage trades.
Principle
The strategy judges trend direction by comparing fast and slow moving averages. It goes long when fast MA crosses above slow MA, and goes short when fast MA crosses below slow MA. To avoid oscillating markets, the strategy also incorporates Bollinger Bands. It generates trading signals when the rate of change of BB width exceeds a threshold. Finally, the strategy uses Chandelier exits as stop loss to avoid being trapped in range-bound markets.
Specifically, the trading logic is as follows:
Calculate fast MA (default 20-day) and slow MA (default 50-day).
Calculate the rate of change of Bollinger Band (default 40-day, 2 standard deviations) width.
Go long when fast MA crosses above slow MA, and BB width change rate exceeds default threshold 9%.
Go short when fast MA crosses below slow MA, and BB width change rate exceeds default threshold 9%.
Calculate Chandelier long and short stops.
Long stop is highest high - ATR * multiplier. Short stop is lowest low + ATR * multiplier.
Advantages
MA system effectively tracks trends.
BB width change filters out oscillation, reducing unnecessary trades.
Chandelier exits timely stop losses avoiding being trapped.
Multiple adjustable parameters for optimization.
Clear logic, easy to understand and implement.
Risks
MA lag may miss fast reversals.
Improper BB parameters may filter valid signals.
Excessive chandelier exits cause over-trading.
Inadequate parameter optimization leads to holding risks.
Unable to adapt to extreme market changes from major events.
Optimization
Test different MA combinations to find optimal parameters.
Test different BB periods for best volatility filter.
Add other indicators for entry confirmation.
Introduce dynamic stops to better track markets.
Utilize machine learning to auto-optimize for changing markets.
Summary
This strategy integrates MA system, BB indicator and chandelier exits to form a relatively stable trend following system. Proper parameter optimization can achieve good results. But risks of trend reversal and oscillation remain. Machine learning can further enhance robustness. Overall a good strategy for learning.
/*backtest
start: 2022-10-11 00:00:00
end: 2023-10-17 00:00:00
period: 1d
basePeriod: 1h
exchanges: [{"eid":"Futures_Binance","currency":"BTC_USDT"}]
*/

// This source code is subject to the terms of the Mozilla Public License 2.0 at https://mozilla.org/MPL/2.0/
// © juanchez

//@version=4
strategy("CHI", overlay = true, close_entries_rule = "ANY")

n = input(title= "highest high o lowest low period", defval= 22)
f= input(title= "multiplicador", defval= 4)
long = highest(high, n) - atr(n)*f
short= lowest(low, n) + atr(n)*f
plot(long, color= color.red)
plot(short, color= color.green)

//moving averages
period= input(title= "moving averages period", defval= 50)
period2= input(title= "moving averages period2", defval= 20)
type= input(title= "moving averages type", options= ["sma", "ema"], defval= "ema")

//moving average function
mo(p, t) =>
    if t == "sma"
        sma(close[barstate.islast ? 1: 0], p)
    else  if t== "ema"
        ema(close[barstate.islast ? 1: 0], p)

m= mo(period, type)
m2= mo(period2, type)

trend= m2 > m

plot(m, color = color.maroon, linewidth = 3)
plot(m2, linewidth= 3)


//BOLLINGER BANDS ENTRIES
bb1_period= input(title= "Bollinger bands 1 period", defval=40, minval=1)
bb1_source=input(title="Bollinger band 1 source", defval=close)
bb1_multi=input(title="Bollinger Bands 1 factor", defval=2, minval=1, step=0.1)
show_bb1= input(title="Show Bollinger bands 1", defval=false)
//BOLLINGER BANDS
_bb(src, lenght, multi)=>
    float moving_avg= sma(src[barstate.islast? 1: 0], lenght)
    float deviation= stdev(src[barstate.islast? 1: 0], lenght)
    float lowerband = moving_avg - deviation*multi
    float upperband = moving_avg + deviation*multi

    [moving_avg, lowerband, upperband]

[bb1, lowerband1, upperband1]= _bb(bb1_source,  bb1_period, bb1_multi)

//FIRST BAND
plot(show_bb1? bb1 : na, title="BB1 Moving average", linewidth= 3, color= color.fuchsia)
plot(show_bb1? upperband1 : na, title="BB1 Upper Band", linewidth= 3, color= color.green)
plot(show_bb1? lowerband1 : na, title="BB1 Lower Band", linewidth= 3, color= color.red)

//BB's Width threshold
thresh= input(title= "widen %", defval= 9, minval = 0, step = 1, maxval= 100)

widht= (upperband1 - lowerband1)/bb1
roc= change(widht)/widht[1]*100
cross=crossover(roc, thresh)

// entry
//long
elong= input(true, title= "enable long")
longcondition= m2 > m and cross and elong

//short
eshort= input(true, title= "enable short")
shortcondition= m2 < m and cross and eshort


plotshape(longcondition? true: false , location= location.belowbar, style= shape.labelup, size= size.small, color= color.green, text= "Buy", textcolor= color.white)
plotshape(shortcondition? true: false , location= location.abovebar, style= shape.labeldown, size= size.small, color= color.red, text= "Sell", textcolor= color.white)

out= crossunder(close, long)
outt= crossover(close, short)

strategy.entry("long", strategy.long, when = longcondition)
strategy.close("long", when = out)

strategy.entry("short", strategy.short, when = shortcondition)
strategy.close("short", when = outt)