Overview
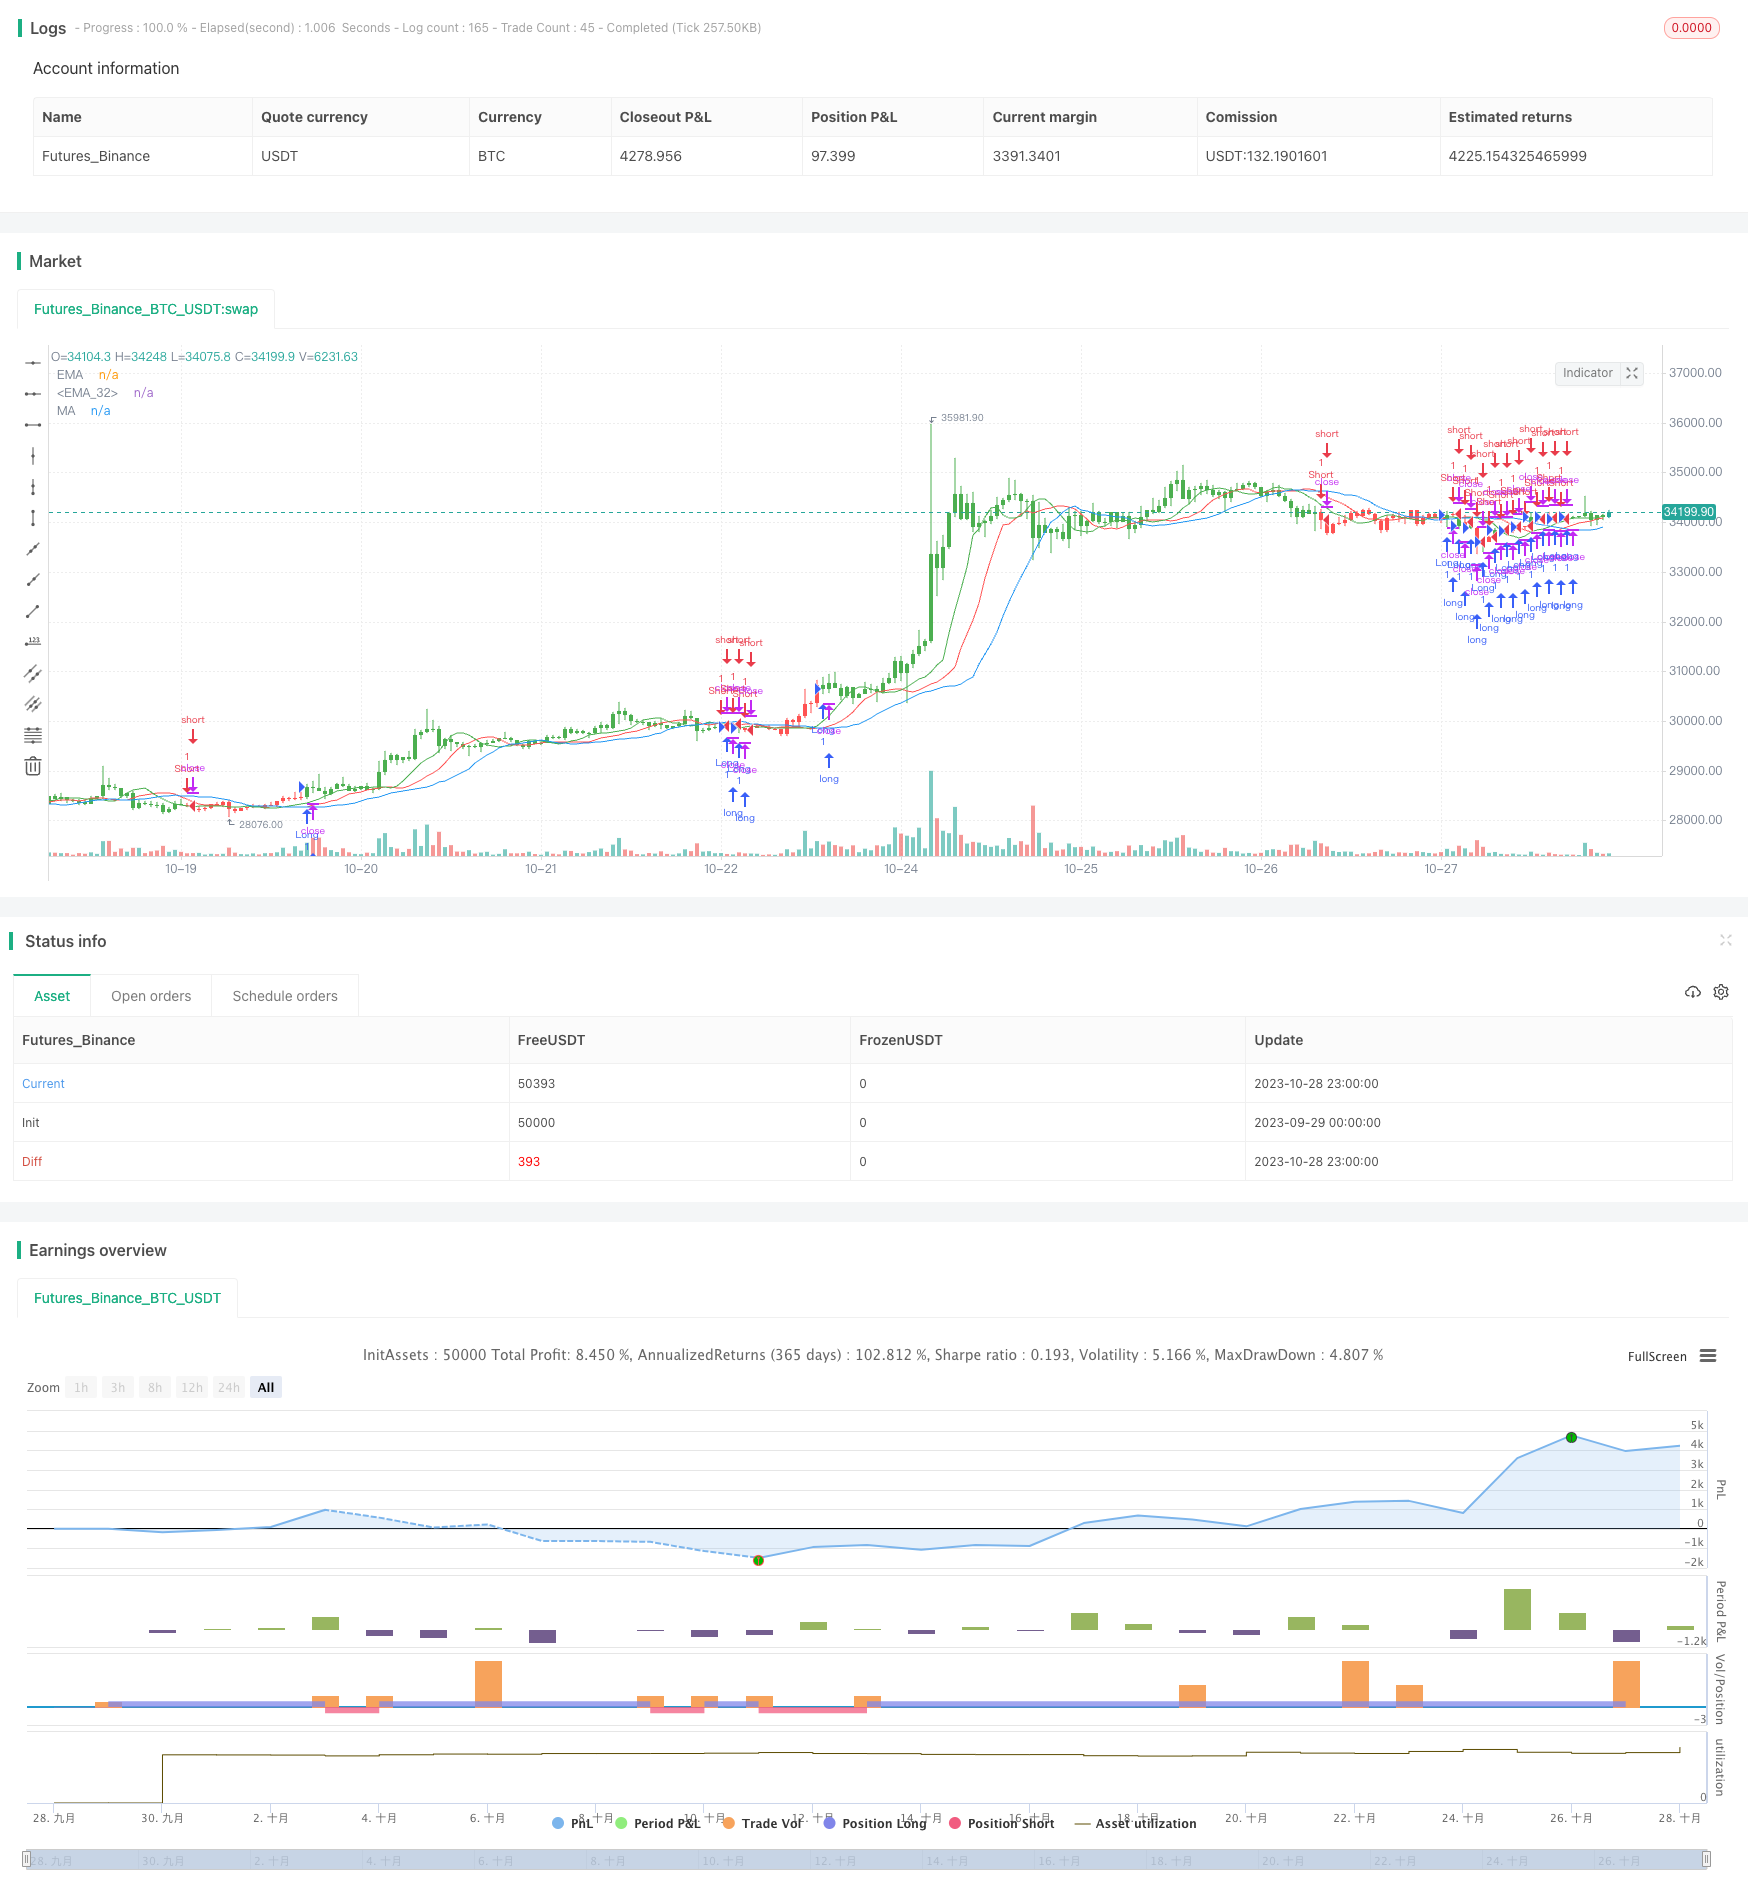
This strategy uses three moving average lines with different parameter settings to determine and follow price trends. It goes long when the short period MA crosses over the medium period MA and the medium period MA crosses over the long period MA, and goes short when the opposite crosses occur.
Principle
Calculate three smoothed moving average lines: long period of 13 bars with displacement of 8 bars; medium period of 8 bars with displacement of 5 bars; short period of 5 bars with displacement of 3 bars. All use the median of close prices.
Compare the relationship between the three lines: go long when short MA crosses over medium MA and medium MA crosses over long MA; go short when opposite crosses occur.
Option to trade in reverse direction.
Plot the three moving average lines.
Advantages
Using three MAs provides multi-layer trend determination and improves signal reliability.
Combination of different period lines considers both short-term momentum and mid-long term trends.
Median price reduces false breakouts.
Line displacements distinguish breakout strength and avoid whipsaws.
Option for reverse trading adapts to different market regimes.
Risks
Multiple MA combinations require parameter optimization, improper settings may degrade signal quality.
Short MA crossovers do not certainly imply trend changes. Further confirmation needed.
Crossover signals may lag, other indicators should assist in timing entry.
Reverse trading requires caution on stop loss to limit risks.
Optimization Directions
Optimize MA lengths and displacements to fit different period cycles.
Add other indicators like volume for signal filtering and reliability.
Optimize stop loss strategies with proper positioning.
Incorporate trendlines and support/resistance for additional context.
Summary
This strategy determines trend reversals using a combination of MAs of varying lengths and displacements. Using multiple MAs improves signal quality, while different period MAs incorporate short, medium and long term features. Parameter optimization, signal filtering, stop loss and other enhancements can further improve robustness and real-world performance.
/*backtest
start: 2023-09-29 00:00:00
end: 2023-10-29 00:00:00
period: 1h
basePeriod: 15m
exchanges: [{"eid":"Futures_Binance","currency":"BTC_USDT"}]
*/

//@version=2
////////////////////////////////////////////////////////////
//  Copyright by HPotter v1.0 01/02/2017
// This indicator calculates 3 Moving Averages for default values of
// 13, 8 and 5 days, with displacement 8, 5 and 3 days: Median Price (High+Low/2).
// The most popular method of interpreting a moving average is to compare
// the relationship between a moving average of the security's price with
// the security's price itself (or between several moving averages).
////////////////////////////////////////////////////////////
strategy(title="Bill Williams Averages. 3Lines", shorttitle="3 Lines", overlay = true)
LLength = input(13, minval=1)
MLength = input(8,minval=1)
SLength = input(5,minval=1)
LOffset = input(8,minval=1)
MOffset = input(5,minval=1)
SOffset = input(3,minval=1)
reverse = input(false, title="Trade reverse")
xLSma = sma(hl2, LLength)[LOffset]
xMSma = sma(hl2, MLength)[MOffset]
xSSma = sma(hl2, SLength)[SOffset]
pos = iff(close < xSSma and xSSma < xMSma and xMSma < xLSma, -1,
	   iff(close > xSSma and xSSma > xMSma and xMSma > xLSma, 1, nz(pos[1], 0)))
possig = iff(reverse and pos == 1, -1,
          iff(reverse and pos == -1, 1, pos))
if (possig == 1)
    strategy.entry("Long", strategy.long)
if (possig == -1)
    strategy.entry("Short", strategy.short)
barcolor(possig == -1 ? red: possig == 1 ? green : blue )
plot(xLSma, color=blue, title="MA")
plot(xMSma, color=red, title="EMA")
plot(xSSma, color=green, title="EMA")