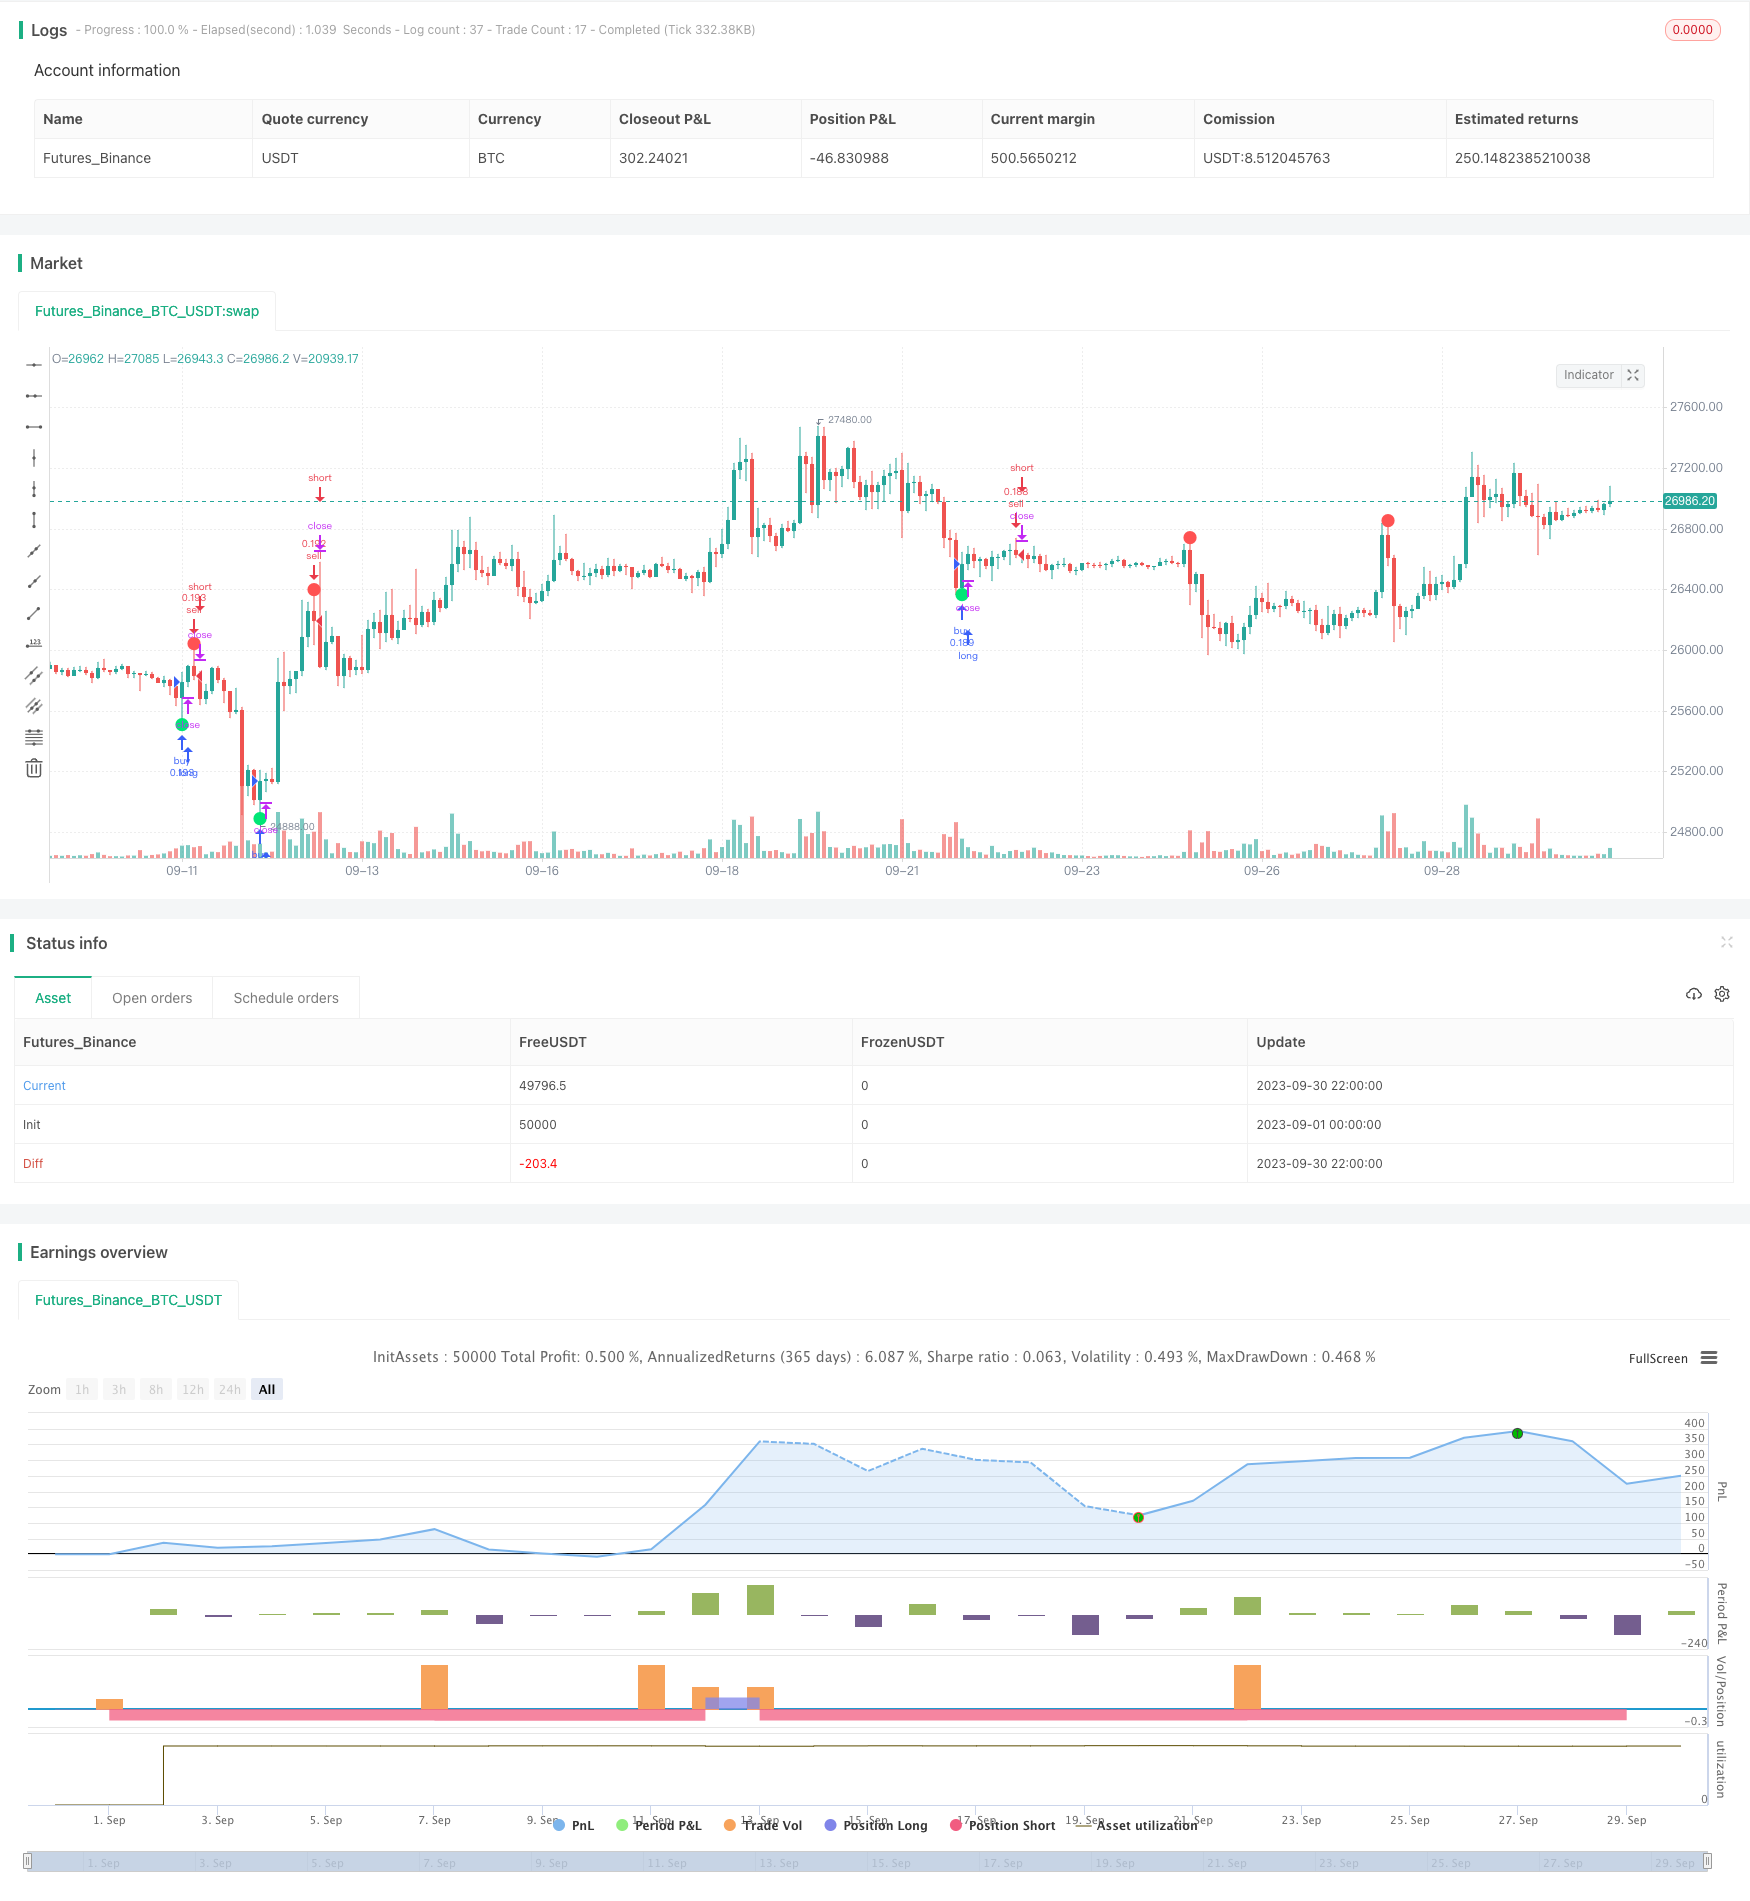
Overview
The Leledec strategy identifies trend reversals by detecting exhaustion patterns in the Leledec indicator. It goes long when major Leledec exhaustion appears and goes short when minor Leledec exhaustion appears. The strategy is suitable for medium to long term trading.
Strategy Logic
The Leledec indicator identifies local extremum points of price. It does so by analyzing the relationship between close and open prices over several bars.
The core logic of the strategy is:
Calculate the major Leledec indicator (maj) using parameters bar count (maj_qual) and lookback period (maj_len).
When major Leledec breaks above maj_qual bars consecutively, and the high of the bar exceeds the highest high over the past maj_len bars, a major Leledec upside exhaustion is identified which generates a long signal.
Calculate the minor Leledec indicator (min) using parameters bar count (min_qual) and lookback period (min_len).
When minor Leledec breaks below min_qual bars consecutively, and the low of the bar is below the lowest low over the past min_len bars, a minor Leledec downside exhaustion is identified which generates a short signal.
According to the logic of the Leledec indicator, exhaustion patterns represent potential extremum points and trend reversals, hence the trading signals.
Advantage Analysis
The strategy has strong capabilities in trend identification. Leledec can effectively detect local extremum points.
Flexibility in adapting to different timeframes and market conditions through parameter tuning.
Can use major Leledec alone or incorporate minor Leledec for more comprehensive signals.
Customizable sensitivity through bar count and lookback period parameters.
Risk Analysis
Potential for false signals, requires validation using other indicators.
Parameter optimization needed for different products and timeframes. Improper parameters may cause over-trading or missed trades.
Mainly relies on candlestick patterns, may miss opportunities during short term price oscillations.
Need to watch real bodies of signal bars for failed trend reversals.
Optimization
Optimize parameter combinations for better adaptability. Consider dynamic optimization.
Incorporate other indicators like volume, moving averages etc. to filter signals.
Implement stop loss to control downside on single trades.
Incorporate short term indicators to catch opportunities from minor oscillations.
Test on different products to find optimal environment.
Optimize money management strategies like position sizing, risk per trade etc.
Conclusion
The Leledec strategy catches trend reversals by identifying extremum patterns in the Leledec indicator. It is an effective trend following methodology. While advantageous in assessing trends, further optimization, additional signal validation, and proper risk management is needed for long term profitability. Overall, the Leledec strategy provides a valuable addition to a trader’s toolkit.
/*backtest
start: 2023-09-01 00:00:00
end: 2023-09-30 23:59:59
period: 2h
basePeriod: 15m
exchanges: [{"eid":"Futures_Binance","currency":"BTC_USDT"}]
*/

// This source code is subject to the terms of the Mozilla Public License 2.0 at https://mozilla.org/MPL/2.0/
// © Joy_Bangla

//@version=4
strategy("A Strategy for Leledec", shorttitle ="Leledec Strategy", overlay=true, commission_value=0.075, initial_capital=10000, default_qty_type = strategy.percent_of_equity, default_qty_value = 10)

maj = input(true, "Major Leledec Exhausion Bar ::  Show")
min=input(false, "Minor Leledec Exhausion Bar ::  Show")
leledcSrc = input(close, "Major Leledec Exhausion Bar ::  Source")
maj_qual = input(6, "Major Leledec Exhausion Bar ::  Bar count no")
maj_len = input(30, "Major Leledec Exhausion Bar ::  Highest / Lowest")
min_qual=input(5, "Minor Leledec Exhausion Bar ::  Bar count no")
min_len=input(5, "Minor Leledec Exhausion Bar ::  Bar count no")
bindexSindex = input(1, "bindexSindex")
closeVal = input(4, "Close")

lele(qual, len) =>
    bindex = 0
    sindex = 0
    bindex := nz(bindex[bindexSindex], 0)
    sindex := nz(sindex[bindexSindex], 0)
    ret = 0
    if close > close[closeVal]
        bindex := bindex + 1
        bindex
    if close < close[closeVal]
        sindex := sindex + 1
        sindex
    if bindex > qual and close < open and high >= highest(high, len)
        bindex := 0
        ret := -1
        ret
    if sindex > qual and close > open and low <= lowest(low, len)
        sindex := 0
        ret := 1
        ret
    return = ret
    return

major = lele(maj_qual, maj_len)
minor=lele(min_qual,min_len)

plotchar(maj ? major == -1 ? high : na : na, char='•', location=location.absolute, color=color.red, transp=0, size=size.large)
plotchar(maj ? major == 1 ? low : na : na, char='•', location=location.absolute, color=color.lime, transp=0, size=size.large)

plotchar(min ? (minor==1?high:na) : na, char='x', location=location.absolute, color=color.red, transp=0, size=size.small)
plotchar(min ? (minor==-1?low:na) : na, char='x', location=location.absolute, color=color.lime, transp=0, size=size.small)

leledecMajorBullish = major==1?low:na
leledecMajorBearish = major==-1?high:na

leledecMinorBullish = minor==1?low:na
leledecMinorBearish = minor==-1?high:na


buySignalBasedOnMajorLeledecOnly = major==1?low:na
sellSignalBasedOnMajorLeldecOnly = minor==-1?high:na


// === INPUT BACKTEST RANGE ===
fromMonth = input(defval = 1,    title = "From Month",      type = input.integer, minval = 1, maxval = 12)
fromDay   = input(defval = 1,    title = "From Day",        type = input.integer, minval = 1, maxval = 31)
fromYear  = input(defval = 2018, title = "From Year",       type = input.integer, minval = 2017, maxval = 2030)
thruMonth = input(defval = 12,    title = "Thru Month",      type = input.integer, minval = 1, maxval = 11)
thruDay   = input(defval = 1,    title = "Thru Day",        type = input.integer, minval = 1, maxval = 30)
thruYear  = input(defval = 2030, title = "Thru Year",       type = input.integer, minval = 2017, maxval = 2030)

// === INPUT SHOW PLOT ===
showDate  = input(defval = true, title = "Show Date Range", type = input.bool)

// === FUNCTION EXAMPLE ===
start     = timestamp(fromYear, fromMonth, fromDay, 00, 00)        // backtest start window
finish    = timestamp(thruYear, thruMonth, thruDay, 23, 59)        // backtest finish window
window()  => time >= start and time <= finish ? true : false       // create function "within window of time"

if (window())
    strategy.entry("buy", strategy.long, when=buySignalBasedOnMajorLeledecOnly)
    strategy.entry("sell", strategy.short, when=sellSignalBasedOnMajorLeldecOnly)