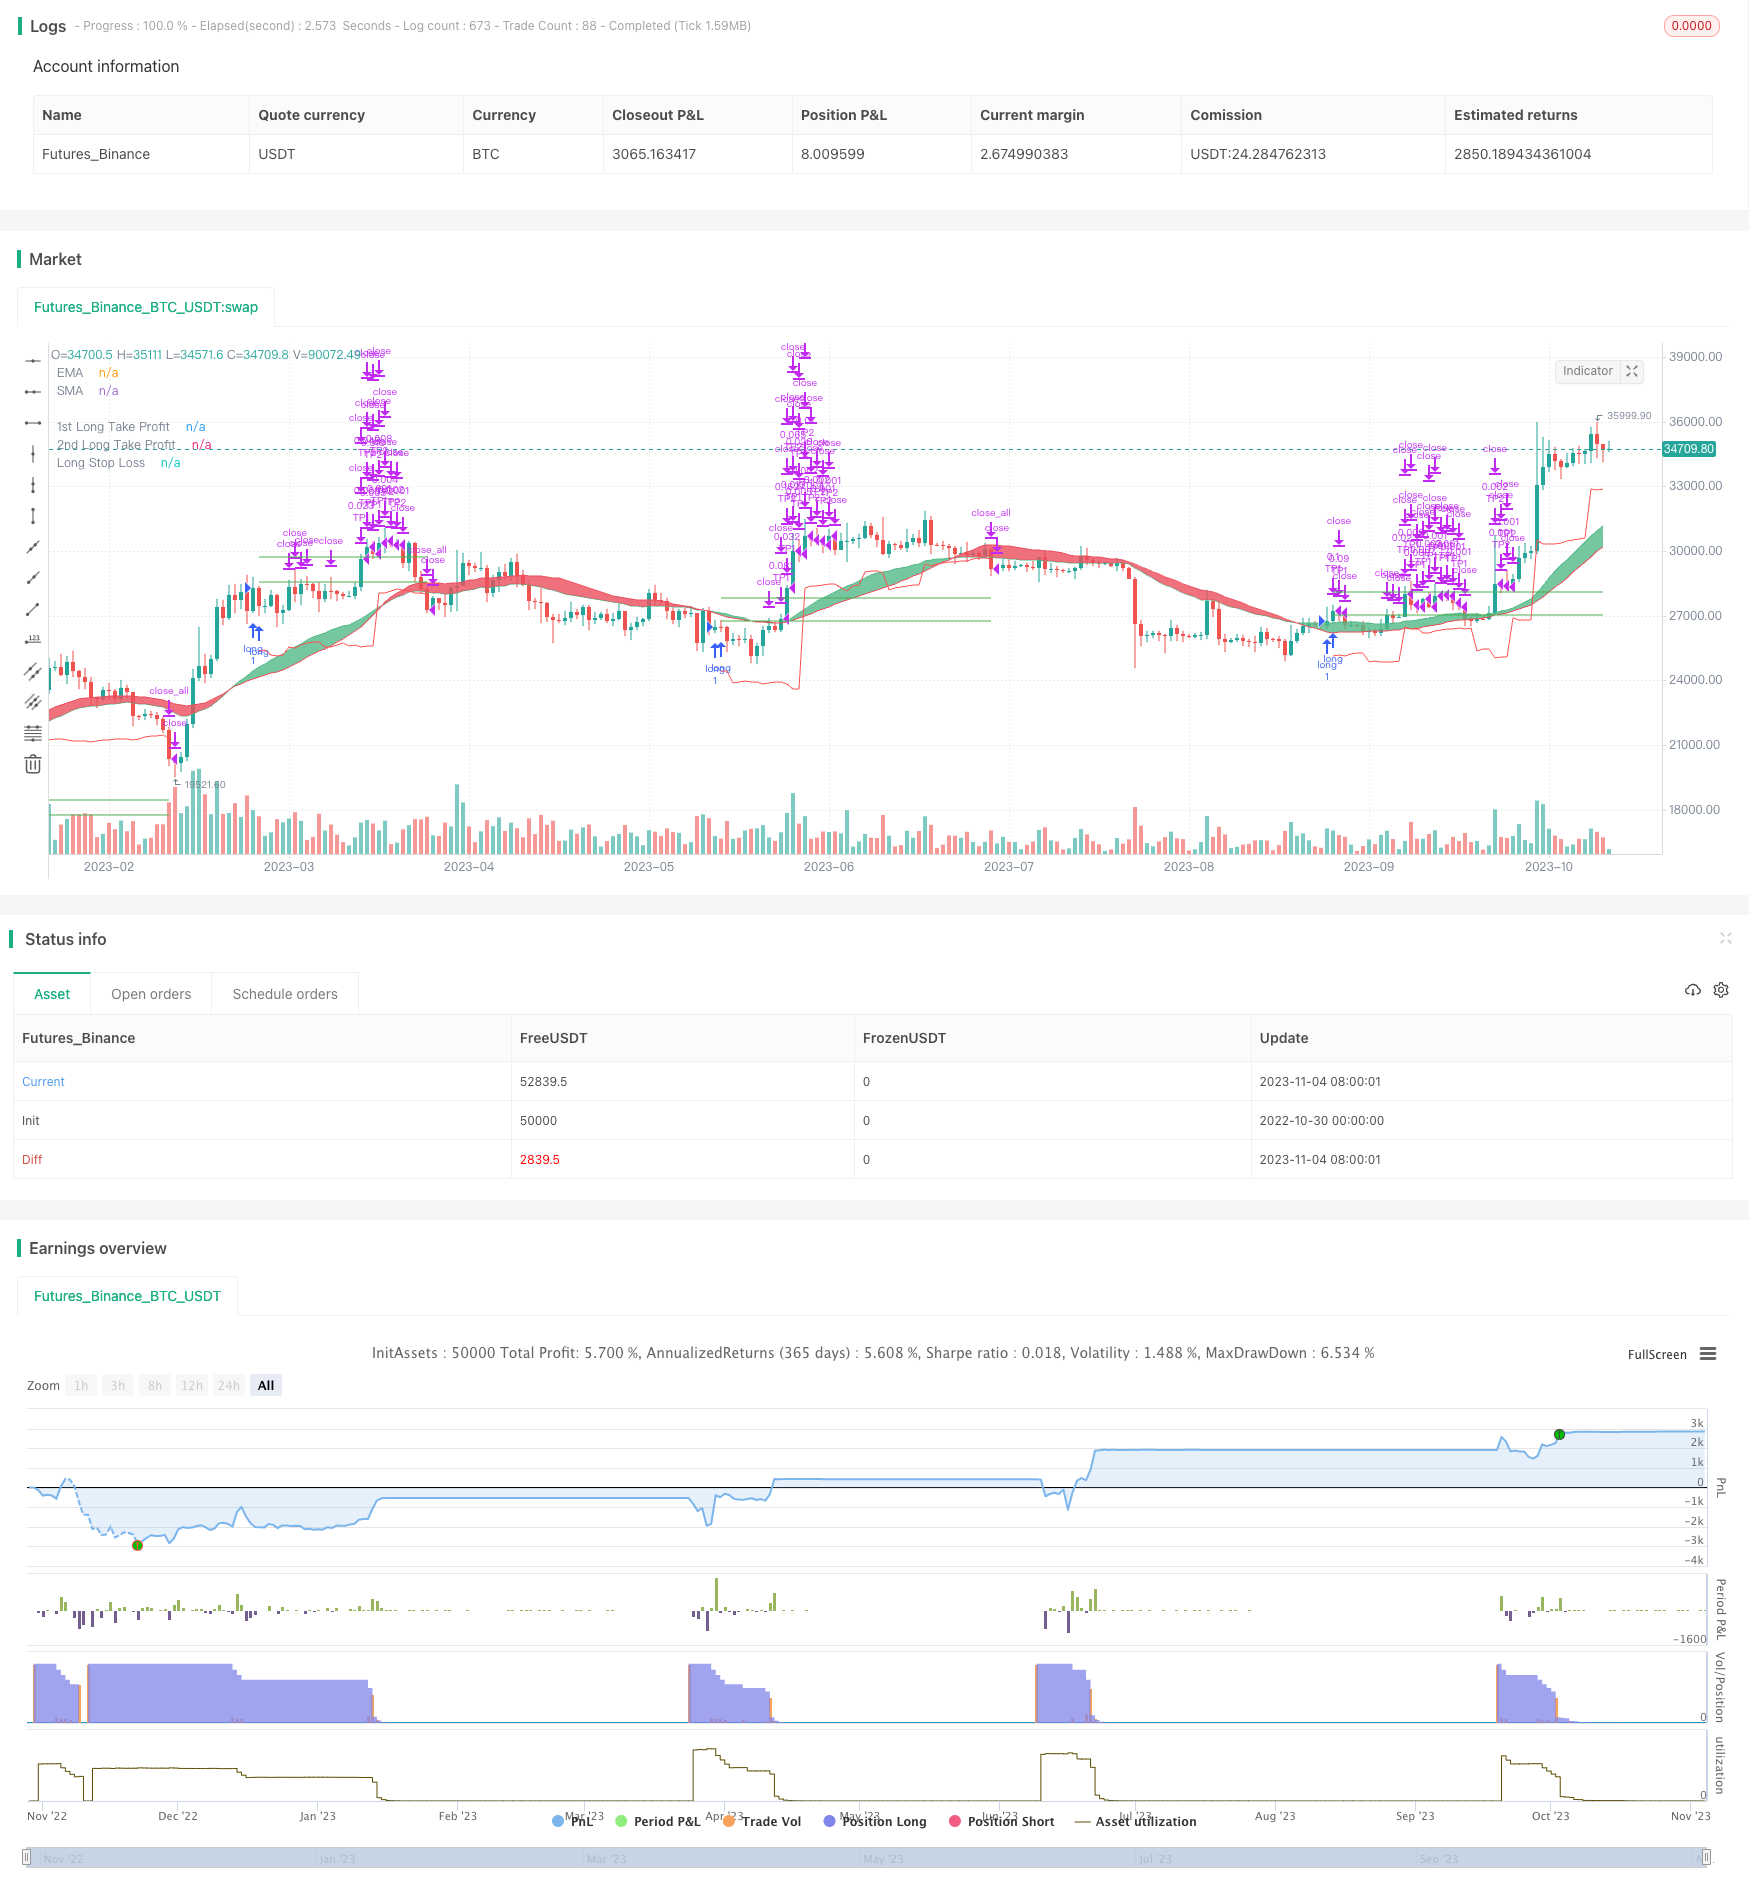
Overview
This strategy uses MACD to determine the trend direction, combined with EMA and SMA crossover as confirmation. The entry signal is when MACD histogram crosses above signal line and the trend is up. The stop loss is set at the price level below the floating ATR trailing stop. The strategy also exits partially to take profit, exits more on larger price surge, and holds some position with trailing stop until stop loss is hit.
Logic
Entry Signal
When faster EMA crosses above slower EMA, it indicates the short term trend is better than long term trend, signaling a buy. Meanwhile, faster SMA crossing above slower SMA also suggests stronger upside momentum in short term. So the combination of MACD line crossing above signal and uptrend based on EMA&SMA crossover helps identify stronger entry signals.
Stop Loss
ATR is used to calculate the stop loss level. ATR can effectively measure the price fluctuation range. When price breaks below this range, the stop loss is triggered. The ATR period can be adjusted - smaller period allows more precise stop but easier to get stopped out, while larger period gives wider stop but more robust. The stop level also trails the price upside, achieving trend following effect.
Exit Signals
Exits partially on small price surge to take profit. Exits more on large price spike to lock in profit. Keeps some position with trailing stop until stop loss is hit. This helps lock in profit, while still be able to hold position for some period.
Advantages
- MACD judging trend combined with EMA/SMA crossover confirms entry timing
- ATR trailing stop allows effective stop loss while following trend
- Partial exits help take profit, lock in profit and hold for duration
Risks & Solutions
Risk of wrong signal from MACD and trend indicators. Fine tune parameters or add other indicators.
Risk of ATR stop loss being hit. Can increase ATR period or stop loss multiplier.
Risk of trailing position being trapped. Reduce trailing position size and cut loss in time.
Enhancement Opportunities
Optimize MACD parameters for better trend judgment
Optimize ATR period for better stop loss level
Optimize exit ratios and position sizing to reduce trapped risk
Consider adding moving take profit or volatility index to improve stop loss
Summary
The strategy combines MACD, EMA/SMA and other indicators to determine trend and entry timing accurately. The floating ATR stop loss helps lock in profit while following the trend. Exits are staggered to take profit, ensure gain and hold position for duration. Overall it is stable with decent result. But parameters and exits can be further optimized for better return.
/*backtest
start: 2022-10-30 00:00:00
end: 2023-11-05 00:00:00
period: 1d
basePeriod: 1h
exchanges: [{"eid":"Futures_Binance","currency":"BTC_USDT"}]
*/

// This source code is subject to the terms of the Mozilla Public License 2.0 at https://mozilla.org/MPL/2.0/
// © Deobald

//@version=4
strategy("MACD Strategy", overlay=true)

// FUNCTIONS

Ema(src,p) =>
    ema = 0.
    sf = 2/(p+1)
    ema := nz(ema[1] + sf*(src - ema[1]),src)

Sma(src,p) => a = cum(src), (a - a[max(p,0)])/max(p,0)

Atr(p) =>
    atr = 0.
    Tr = max(high - low, max(abs(high - close[1]), abs(low - close[1])))
    atr := nz(atr[1] + (Tr - atr[1])/p,Tr)

/// TREND
ribbon_period = input(34, "Period", step=1)

leadLine1 = ema(close, ribbon_period)
leadLine2 = sma(close, ribbon_period)

p3 = plot(leadLine1, color= #53b987, title="EMA", transp = 50, linewidth = 1)
p4 = plot(leadLine2, color= #eb4d5c, title="SMA", transp = 50, linewidth = 1)
fill(p3, p4, transp = 60, color = leadLine1 > leadLine2 ? #53b987 : #eb4d5c)


// MACD
fast_length = input(title="Fast Length", type=input.integer, defval=3)
slow_length = input(title="Slow Length", type=input.integer, defval=5)
src = input(title="Source", type=input.source, defval=close)
signal_length = input(title="Signal Smoothing", type=input.integer, minval = 1, maxval = 50, defval = 2)
sma_source = input(title="Simple MA(Oscillator)", type=input.bool, defval=false)
sma_signal = input(title="Simple MA(Signal Line)", type=input.bool, defval=true)

// Plot colors
col_grow_above = #26A69A
col_grow_below = #FFCDD2
col_fall_above = #B2DFDB
col_fall_below = #EF5350
col_macd = #0094ff
col_signal = #ff6a00

// Calculating
fast_ma = sma_source ? Sma(src, fast_length) : Ema(src, fast_length)
slow_ma = sma_source ? Sma(src, slow_length) : Ema(src, slow_length)
macd = fast_ma - slow_ma
signal = sma_signal ? Sma(macd, signal_length) : Ema(macd, signal_length)
hist = macd - signal

//plot(hist, title="Histogram", style=plot.style_columns, color=(hist>=0 ? (hist[1] < hist ? col_grow_above : col_fall_above) : (hist[1] < hist ? col_grow_below : col_fall_below) ), transp=0 )
// plot(macd, title="MACD", color=col_macd, transp=0)
// plot(signal, title="Signal", color=col_signal, transp=0)


// TAKE PROFIT AND STOP LOSS
long_tp1_inp = input(1, title='Long Take Profit 1 %', step=0.1)/100
long_tp1_qty = input(10, title="Long Take Profit 1 Qty", step=1)

long_tp2_inp = input(5, title='Long Take Profit 2%', step=0.1)/100
long_tp2_qty = input(50, title="Long Take Profit 2 Qty", step=1)

long_take_level_1 = strategy.position_avg_price * (1 + long_tp1_inp)
long_take_level_2 = strategy.position_avg_price * (1 + long_tp2_inp)


// Stop Loss
multiplier = input(2.2, "SL Mutiplier", minval=1, step=0.1)
ATR_period=input(17,"ATR period", minval=1, step=1)

// Strategy
entry_long=crossover(macd,signal) and leadLine2 < leadLine1
entry_price_long=valuewhen(entry_long,close,0)
SL_floating_long = entry_price_long - multiplier*Atr(ATR_period)
exit_long= close < SL_floating_long

///// BACKTEST PERIOD ///////
testStartYear = input(2018, "Backtest Start Year")
testStartMonth = input(1, "Backtest Start Month")
testStartDay = input(1, "Backtest Start Day")
testPeriodStart = timestamp(testStartYear, testStartMonth, testStartDay, 0, 0)

testStopYear = input(2020, "Backtest Stop Year")
testStopMonth = input(12, "Backtest Stop Month")
testStopDay = input(31, "Backtest Stop Day")
testPeriodStop = timestamp(testStopYear, testStopMonth, testStopDay, 0, 0)

testPeriod() => true

if testPeriod()
    strategy.entry("long", strategy.long, comment="Long", when=entry_long)
    strategy.exit("TP1","long", qty_percent=long_tp1_qty, limit=long_take_level_1)//, trail_points=entry_price_long * long_trailing / syminfo.mintick, trail_offset=entry_price_long * long_trailing / syminfo.mintick)
    strategy.exit("TP2", qty_percent=long_tp2_qty, limit=long_take_level_2) //, trail_points=entry_price_long * long_trailing / syminfo.mintick, trail_offset=entry_price_long * long_trailing / syminfo.mintick)
    strategy.close_all("long", when=exit_long, comment="exit long" )


// LONG POSITION
plot(strategy.position_size > 0 ? long_take_level_1 : na, style=plot.style_linebr, color=color.green, linewidth=1, title="1st Long Take Profit")
plot(strategy.position_size > 0 ? long_take_level_2 : na, style=plot.style_linebr, color=color.green, linewidth=1, title="2nd Long Take Profit")
plot(strategy.position_size > 0 ? SL_floating_long : na, style=plot.style_linebr, color=color.red, linewidth=1, title="Long Stop Loss")