Multi-indicator Crossover Strong Trend Tracking Strategy
Author: ChaoZhang, Date: 2023-11-13 16:59:12Tags:

Overview
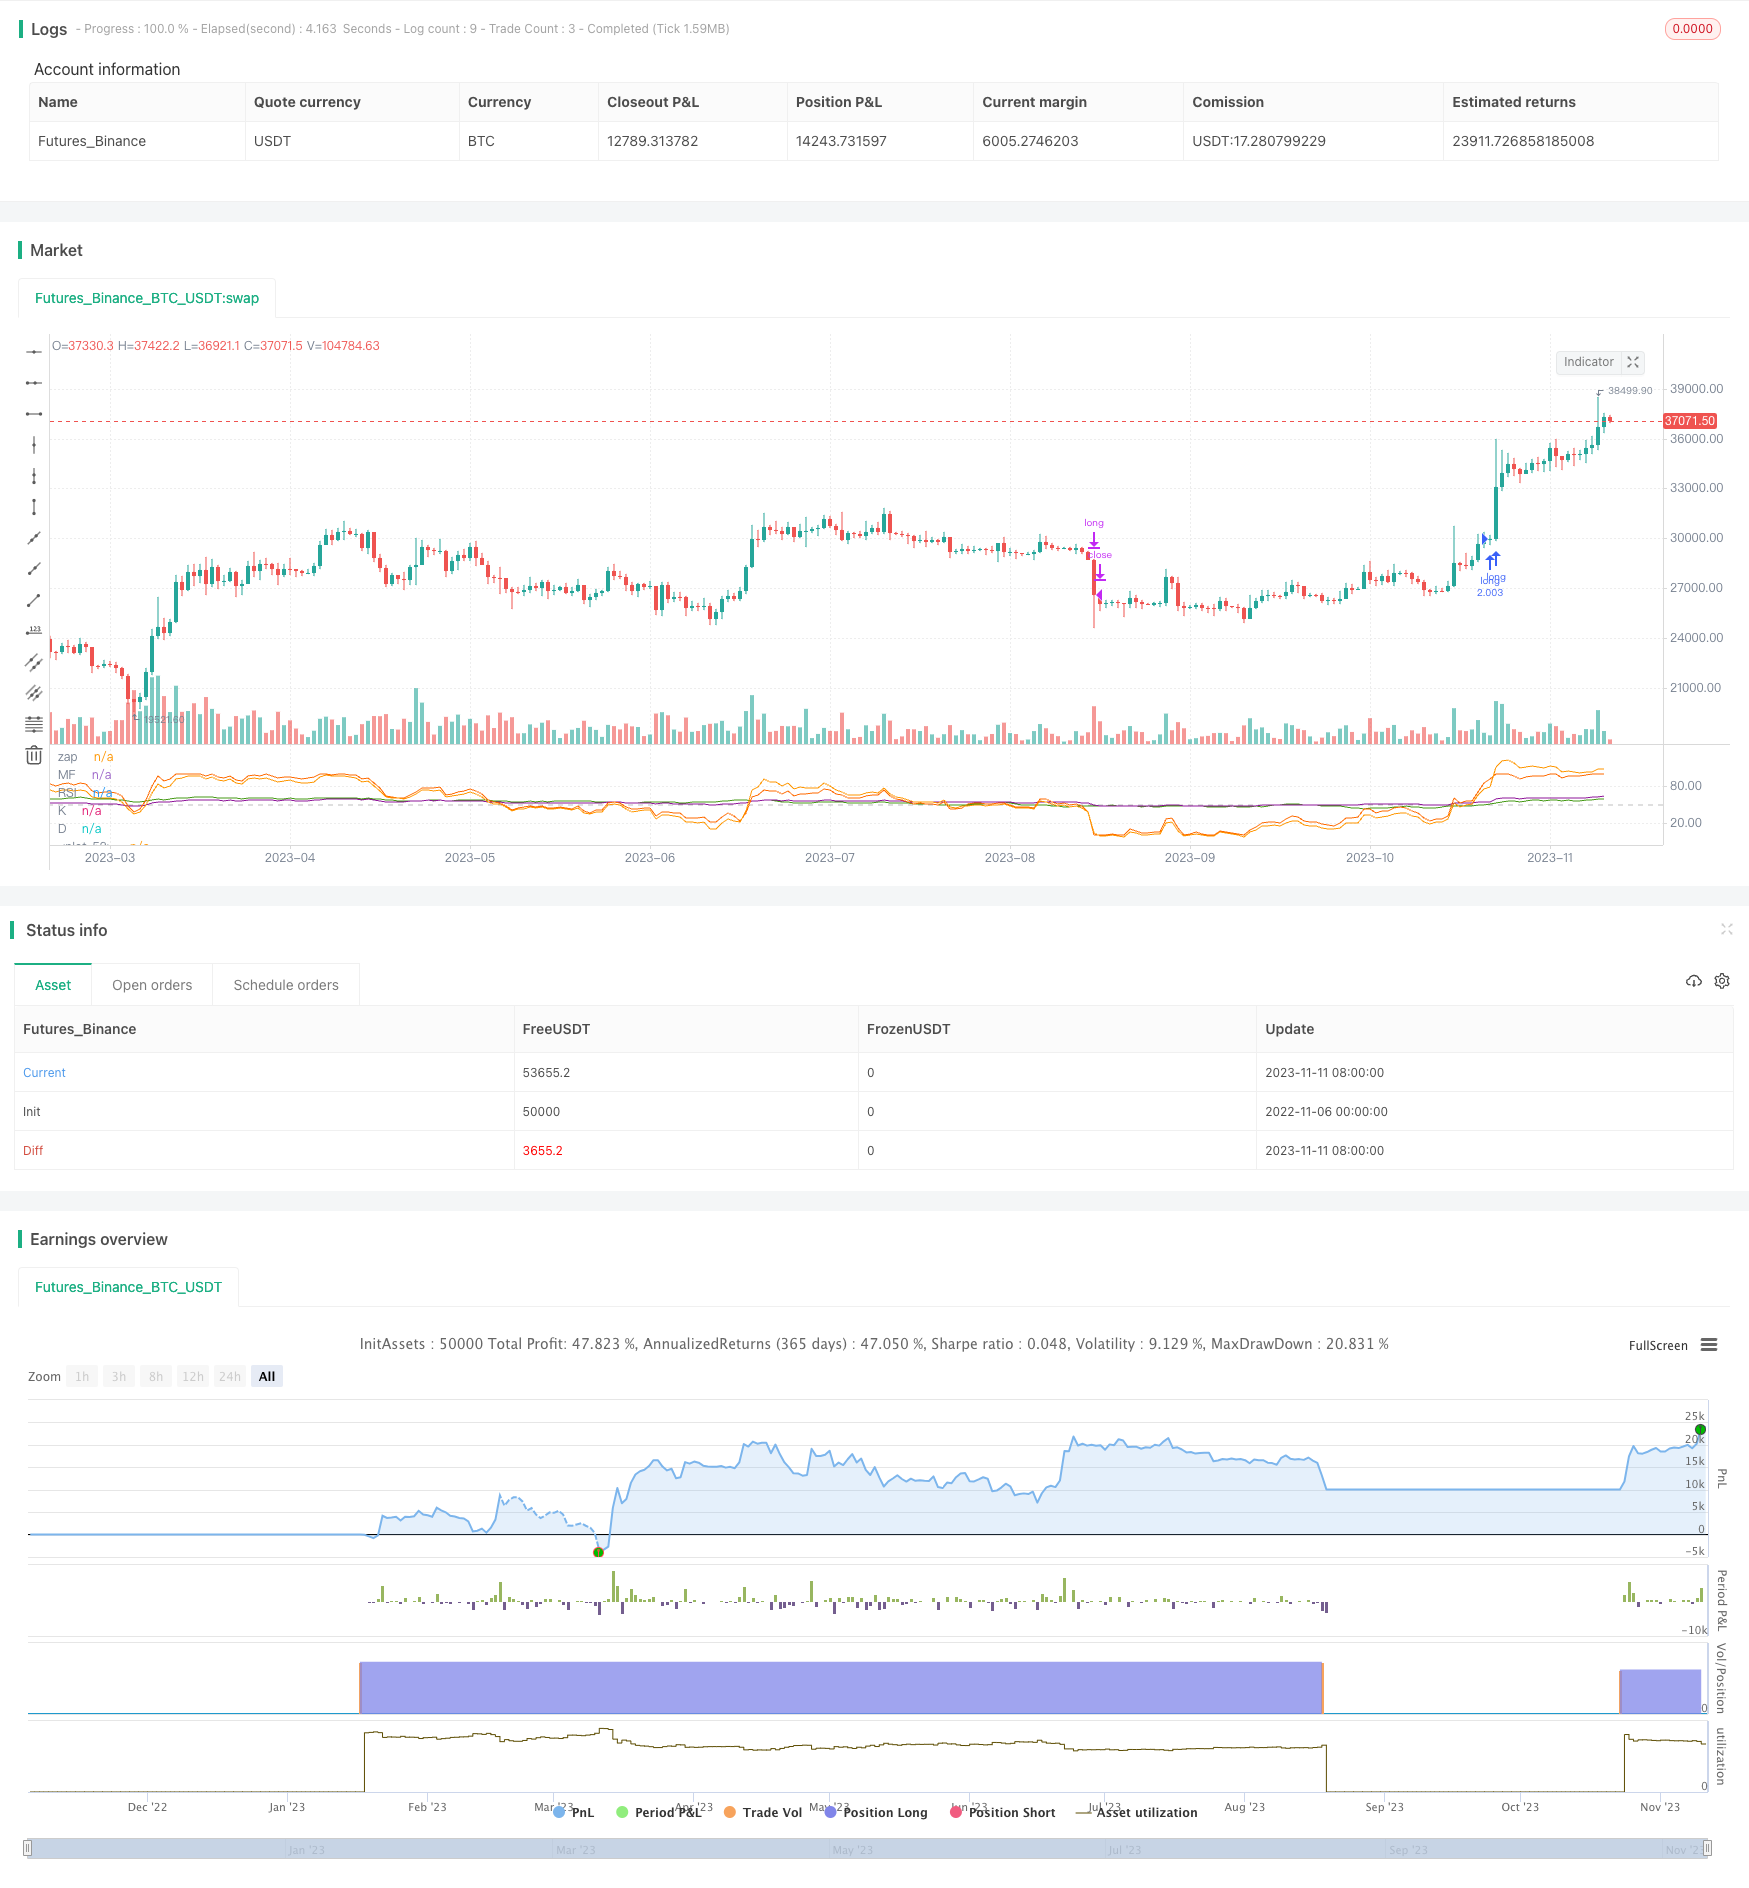
This strategy integrates multiple strong momentum indicators including RSI, MF, CCI and Stoch RSI to identify and track strong trends through indicator crossovers. It first calculates multiple cycle indicators, then takes the average value. When all indicators break through the strong threshold, a buy signal is generated. When indicators fall below the weak threshold, a sell signal is generated to capture trend turning points and track strong trends.
Strategy Logic
This strategy calculates four strong momentum indicators - RSI, MF, CCI and Stoch RSI. RSI judges strength by calculating price changes over a period. MF also considers the ratio of ups and downs. CCI judges overbought/oversold levels by calculating the deviation from moving average. Stoch RSI incorporates the KDJ calculation method on top of RSI.
The strategy sets 50 as the neutral level for indicators. When RSI, MF, CCI, Stoch RSI K and D lines all cross above 50, a buy signal is generated, indicating a strong uptrend. When indicators fall below 50, a sell signal is generated, suggesting sideways or downtrend. After entering, a wide stop loss is set to track the strong trend.
The advantage of this strategy is that the indicators are comprehensive, containing multiple methods to gauge price momentum and can verify each other to avoid misalignment. Taking average value can filter out some noise.
Advantages
-
Comprehensive indicators including RSI, MF, CCI and Stoch RSI for strong momentum judgment and verification, improving accuracy.
-
Taking average value of indicators filters noise and makes signals more reliable.
-
Using multiple indicator crossover as entry timing effectively identifies strong trend turning points.
-
The wide stop loss range enables tracking the strong trend for excess returns.
-
The strategy logic is clear and easy to understand, parameters are reasonable for live trading.
Risks
-
Risk of strong trend reversal. Sudden reversals may cause the strategy to stop loss.
-
Risk of fluctuations within trend. Price may have large pullbacks during uptrends, requiring reasonable stop loss ranges.
-
Risk in bear markets. The strategy is mainly for tracking strong trends, may underperform in bear markets.
-
Parameter optimization risk. Indicator parameters need testing and optimization for different products, otherwise performance may suffer.
-
Risks can be managed through proper stop loss, parameter testing, position adjustment etc.
Optimization Directions
-
Test different parameter combinations to find optimal cycles for RSI, CCI etc. for specific products.
-
Introduce more indicator types like volatility indicators, volume indicators to enrich logic.
-
Automatically adjust position sizes based on market conditions.
-
Adopt dynamic stop loss, trailing stops based on market fluctuation levels.
-
Explore staged crossover possibilities, enter trades based on first-level indicators, then track trends with second-level indicators.
Conclusion
This strategy identifies and tracks strong trends by crossovers of RSI, MF, CCI, Stoch RSI and other strong momentum indicators. The comprehensive and complementary indicators with average value calculation effectively filter out false signals. The indicator crossover entry timing is reliable, and wide stop loss range allows persistent trend tracking. But reversal risks need caution, and parameter optimization is important. Overall, the strategy has a simple and clear concept, and can achieve good trend tracking effect through indicator verification, stop loss optimization.
/*backtest
start: 2022-11-06 00:00:00
end: 2023-11-12 00:00:00
period: 1d
basePeriod: 1h
exchanges: [{"eid":"Futures_Binance","currency":"BTC_USDT"}]
*/

// This source code is subject to the terms of the Mozilla Public License 2.0 at https://mozilla.org/MPL/2.0/
// © SoftKill21

//@version=4

strategy(title="something", initial_capital = 1000, default_qty_type=strategy.percent_of_equity, default_qty_value=100, commission_type=strategy.commission.percent, commission_value=0.03, pyramiding=1  )

length = input(title="Length", type=input.integer, defval=100, minval=1, maxval=2000)
src = hlc3
upper = sum(volume * (change(src) <= 0 ? 0 : src), length)
lower = sum(volume * (change(src) >= 0 ? 0 : src), length)
_rsi(upper, lower) =>
    if lower == 0
        100
    if upper == 0
        0
	100.0 - (100.0 / (1.0 + upper / lower))
mf = _rsi(upper, lower)

up = rma(max(change(src), 0), length)
down = rma(-min(change(src), 0), length)
rsi = down == 0 ? 100 : up == 0 ? 0 : 100 - (100 / (1 + up / down))
plot(rsi, "RSI", color=#8E1599)

plot(mf, "MF", color=#459915)
hline(50, title="zap", color=#c0c0c0)


ma = sma(src, length)
cci = (src - ma) / (0.015 * dev(src, length))
//plot(cci, "CCI", color=#996A15)


smoothK = input(1, "K", minval=1)
smoothD = input(1, "D", minval=1)

rsi1 = rsi(src, length)
k = sma(stoch(rsi1, rsi1, rsi1, length), smoothK)
d = sma(k, smoothD)
plot(k, "K", color=#0094FF)
plot(d, "D", color=#FF6A00)

avg = (rsi + mf + cci + k + d)/5

long = rsi > 50 and mf > 50 and cci >50 and (k > 50 or d>50)
short= rsi<49 and mf<49 and cci<0 and (k<50 or d<50)

// long= avg > 100
// short=avg<0

plot(avg)

strategy.entry('long',1,when=long)
strategy.close("long",when=short)
//strategy.entry('short',0,when=short)
//strategy.close("short",when=exitshort)
- Corn Moving Average Balance Trading Strategy
- Dual Reversal Entry Strategy
- Momentum Market Sentiment Indicator Strategy
- Momentum Squeeze Breakout Trend Tracking Strategy
- Inverse MACD Momentum Entangled with DMI Breakout Short-Term Scalping Strategy
- EMA Percentage Channel with Bollinger Band Range Trading Strategy
- Dual EMA Crossover Strategy
- Gradual Stop Loss Movement Strategy
- Momentum Breakout Strategy with Volatility Stop
- Extreme Distribution Swing Strategy
- Momentum Breakout Trading Strategy Based on Price Breakout and Mean Reversion
- Momentum Price Trend Tracking Strategy
- FX Strategy Based on Fractal Waves and SMMA
- Moving Average Crossover and Upper Rail Breakthrough Impulse Strategy
- Coppock Curve Based Quantitative Trading Strategy
- High Probability Breakthrough Trading Strategy Based on Pressure Balance
- Fast RSI Risk Control Compound Futures Trading Strategy
- Dual DI Crossover Daily Trading Strategy
- Bollinger Band Breakout Strategy
- Moving Average Trading Strategy