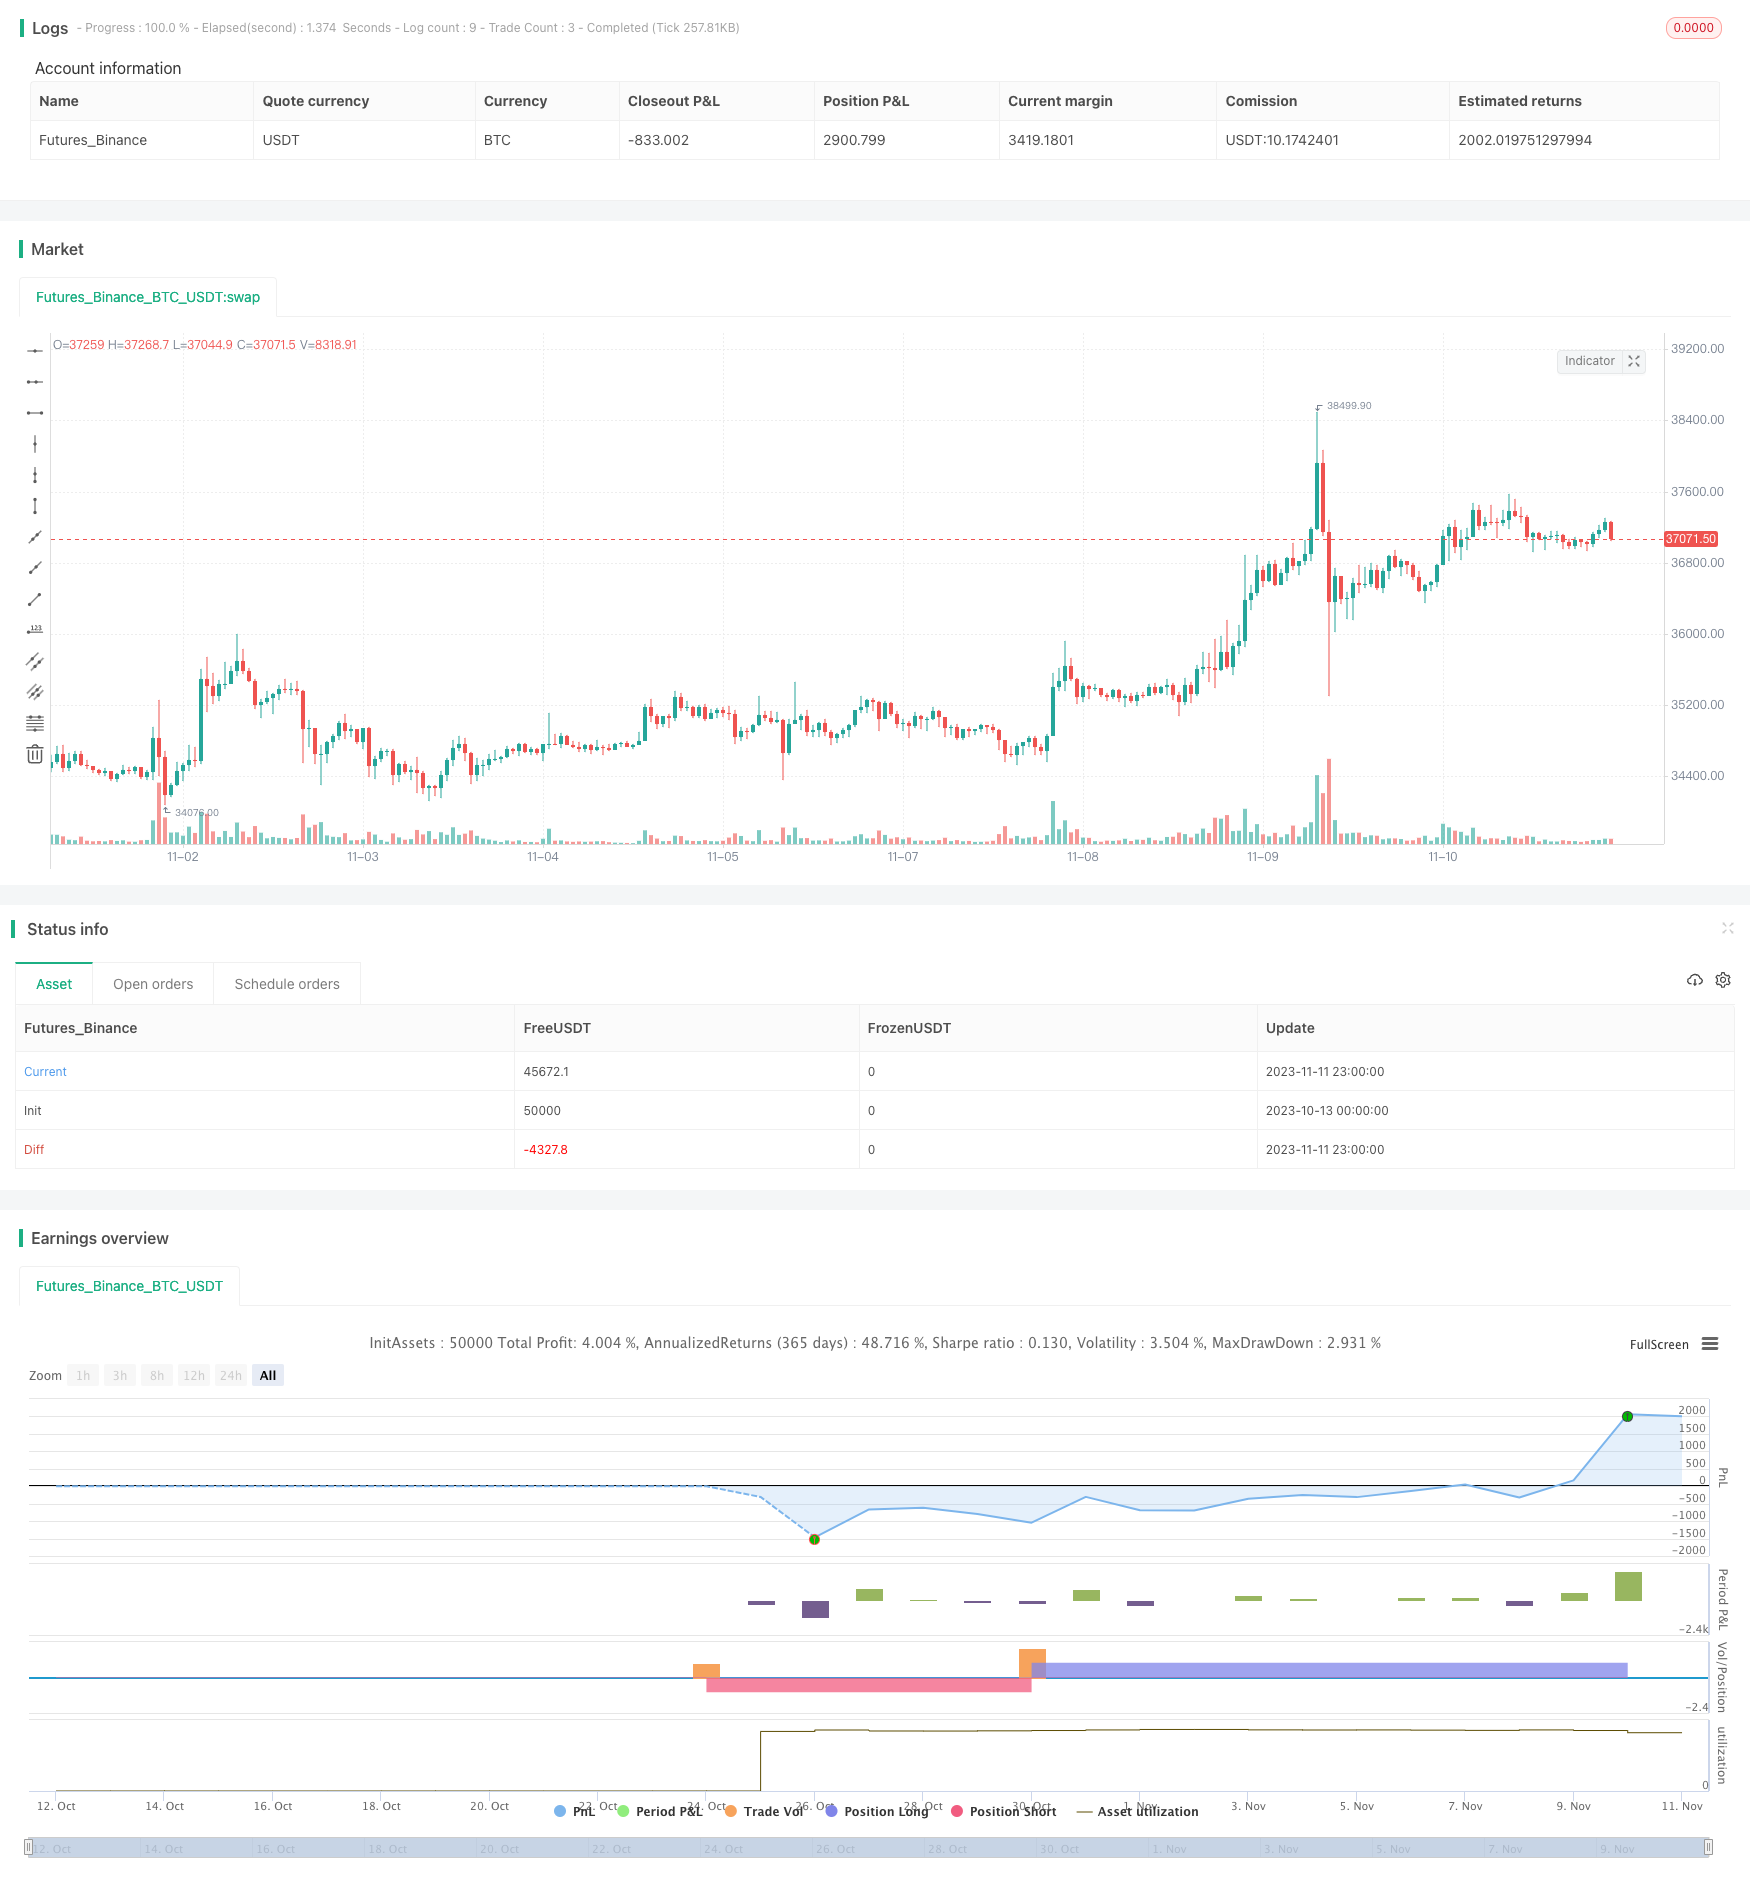
Extreme Distribution Swing Strategy
Author: ChaoZhang, Date: 2023-11-13 17:03:08Tags:

This strategy aims to detect extremes of the Chande Momentum Oscillator using extreme distribution detection on 1-minute timeframes mainly for Bitcoin and cryptocurrencies. However, parameters can be adjusted for any pair.
After extensive research on the Chande momentum oscillator, I decided to create a strategy that uses normal distribution percentile levels to snipe entries. This in turn can create nice profits over consecutive days on the 1-minute timeframe, with the end goal being to get a stronger version of this strategy running on a bot and print some money. The strategy is tightly defined but can also be loosened up to make more trades, giving a higher sample size and better Sharpe ratio.
The strategy checks if the Chande value is in an extreme percentile based on the last few hundred Chande values - if it is it will open a position.
No stop loss or take profit is implemented in the swing yet, but this will be the next addition to really minimize loss and amplify potential profits.
Any liquid crypto pair on the lower timeframes will net a good result with this strategy.
We also have a free 15M and 1H strategy available.
Strategy Logic
The strategy first computes the Chande Momentum Oscillator, which is based on the change between the current period’s close and previous period’s close. Specifically, it measures the momentum of price changes by calculating the ratio of the sum of the uptick changes over the sum of the downtick changes.
It then records the Chande values over a certain lookback period (default 425 periods) and computes the different percentile levels. When the current Chande value reaches a preset extreme percentile (default 1% for buy, 99% for sell), it triggers a long/short entry signal. The exit signals are triggered when the Chande value reaches normal percentile levels (default 97.5% and 2.5%).
In this way, the strategy can capture extreme breakouts of the Chande value, allowing it to catch sudden trending moves. It also avoids the risk of repeated entries when the Chande value stays at extreme levels for prolonged periods.
Advantage Analysis
- Captures market bursts quickly using momentum of Chande indicator
- Low drawdown risk with normal distribution extreme detection
- Flexible parameters adaptable to different market regimes
- Simple and intuitive strategy logic, easy to understand and implement
Risk Analysis
- Chande prone to false signals as momentum indicator sensitive to short-term noise
- Long drawdown periods with extreme value trading, low intraday trade frequency
- Risk of losing swings with no stop loss/profit target
- Overoptimization risk with improper parameter tuning
Risk management should focus on using stops, normalizing extreme parameters, and filtering signals with trend. Avoid over-optimizing parameters.
Optimization Directions
The strategy can be optimized in several aspects:
-
Add stop loss/profit taking to control loss per trade at reasonable levels.
-
Optimize parameters by adjusting short/long lookbacks for different markets. Step-wise walk-forward optimization can find optimal parameters.
-
Add filter conditions with trend indicators like MA to remove false signals against overall trend. Improves strategy robustness.
-
Combine multiple timeframes, using higher TF to gauge trend direction and lower TF for entry.
-
Test parameter robustness across different products, adjust for more varieties.
-
Introduce machine learning to optimize parameters and filters dynamically.
Conclusion
Overall this is a strategy utilizing extreme values of the Chande momentum oscillator to capture trending moves. Its straightforward logic and efficient execution make it very suitable for quickly capitalizing on burst trends. At the same time, controlling risk, avoiding overoptimization, and multi-dimensional optimization are needed to adapt it across market regimes. In summary, it provides an effective approach for trading market bursts worth further research and application.
/*backtest
start: 2023-10-13 00:00:00
end: 2023-11-12 00:00:00
period: 1h
basePeriod: 15m
exchanges: [{"eid":"Futures_Binance","currency":"BTC_USDT"}]
*/

//@version=4
strategy("Chande Minute Swinger", overlay=true)

//Chande

length = input(9, minval=1)
src = close
momm = change(src)
f1(m) => m >= 0.0 ? m : 0.0
f2(m) => m >= 0.0 ? 0.0 : -m
m1 = f1(momm)
m2 = f2(momm)
sm1 = sum(m1, length)
sm2 = sum(m2, length)
percent(nom, div) => 100 * nom / div
chandeMO = percent(sm1-sm2, sm1+sm2)

//Parameters to change

lengthLookback = 425 //425 golden number
buyPercentile = 1
sellPercentile = 99
linePercentileLow = 2.5
linePercentileHigh = 97.5

buy = percentile_nearest_rank(chandeMO, lengthLookback, buyPercentile)
exitBuy= percentile_nearest_rank(chandeMO, lengthLookback, linePercentileHigh)
sell = percentile_nearest_rank(chandeMO, lengthLookback, sellPercentile)
exitSell = percentile_nearest_rank(chandeMO, lengthLookback, linePercentileLow)

chandeMA = sma(chandeMO, 9) //sma for potential other strategies implementing cross / trend

//Entry conditions

closeLongCondition = chandeMO > exitBuy ? true : false
closeShortCondition = chandeMO < exitSell ? true : false
longCondition = chandeMO < buy
shortCondition = chandeMO > sell

if (longCondition)
    strategy.entry("long", strategy.long)


if (shortCondition)
    strategy.entry("short", strategy.short)

//Introducing the closes and a stoploss will minimise loss and bring up the sharpe ratio
//Current settings are enabled for maximum potential but big risk

//strategy.close("long", when=(closeLongCondition == true))
//strategy.close("short", when=(closeShortCondition == true))
- Dual MACD Quantitative Trading Strategy
- Corn Moving Average Balance Trading Strategy
- Dual Reversal Entry Strategy
- Momentum Market Sentiment Indicator Strategy
- Momentum Squeeze Breakout Trend Tracking Strategy
- Inverse MACD Momentum Entangled with DMI Breakout Short-Term Scalping Strategy
- EMA Percentage Channel with Bollinger Band Range Trading Strategy
- Dual EMA Crossover Strategy
- Gradual Stop Loss Movement Strategy
- Momentum Breakout Strategy with Volatility Stop
- Multi-indicator Crossover Strong Trend Tracking Strategy
- Momentum Breakout Trading Strategy Based on Price Breakout and Mean Reversion
- Momentum Price Trend Tracking Strategy
- FX Strategy Based on Fractal Waves and SMMA
- Moving Average Crossover and Upper Rail Breakthrough Impulse Strategy
- Coppock Curve Based Quantitative Trading Strategy
- High Probability Breakthrough Trading Strategy Based on Pressure Balance
- Fast RSI Risk Control Compound Futures Trading Strategy
- Dual DI Crossover Daily Trading Strategy
- Bollinger Band Breakout Strategy