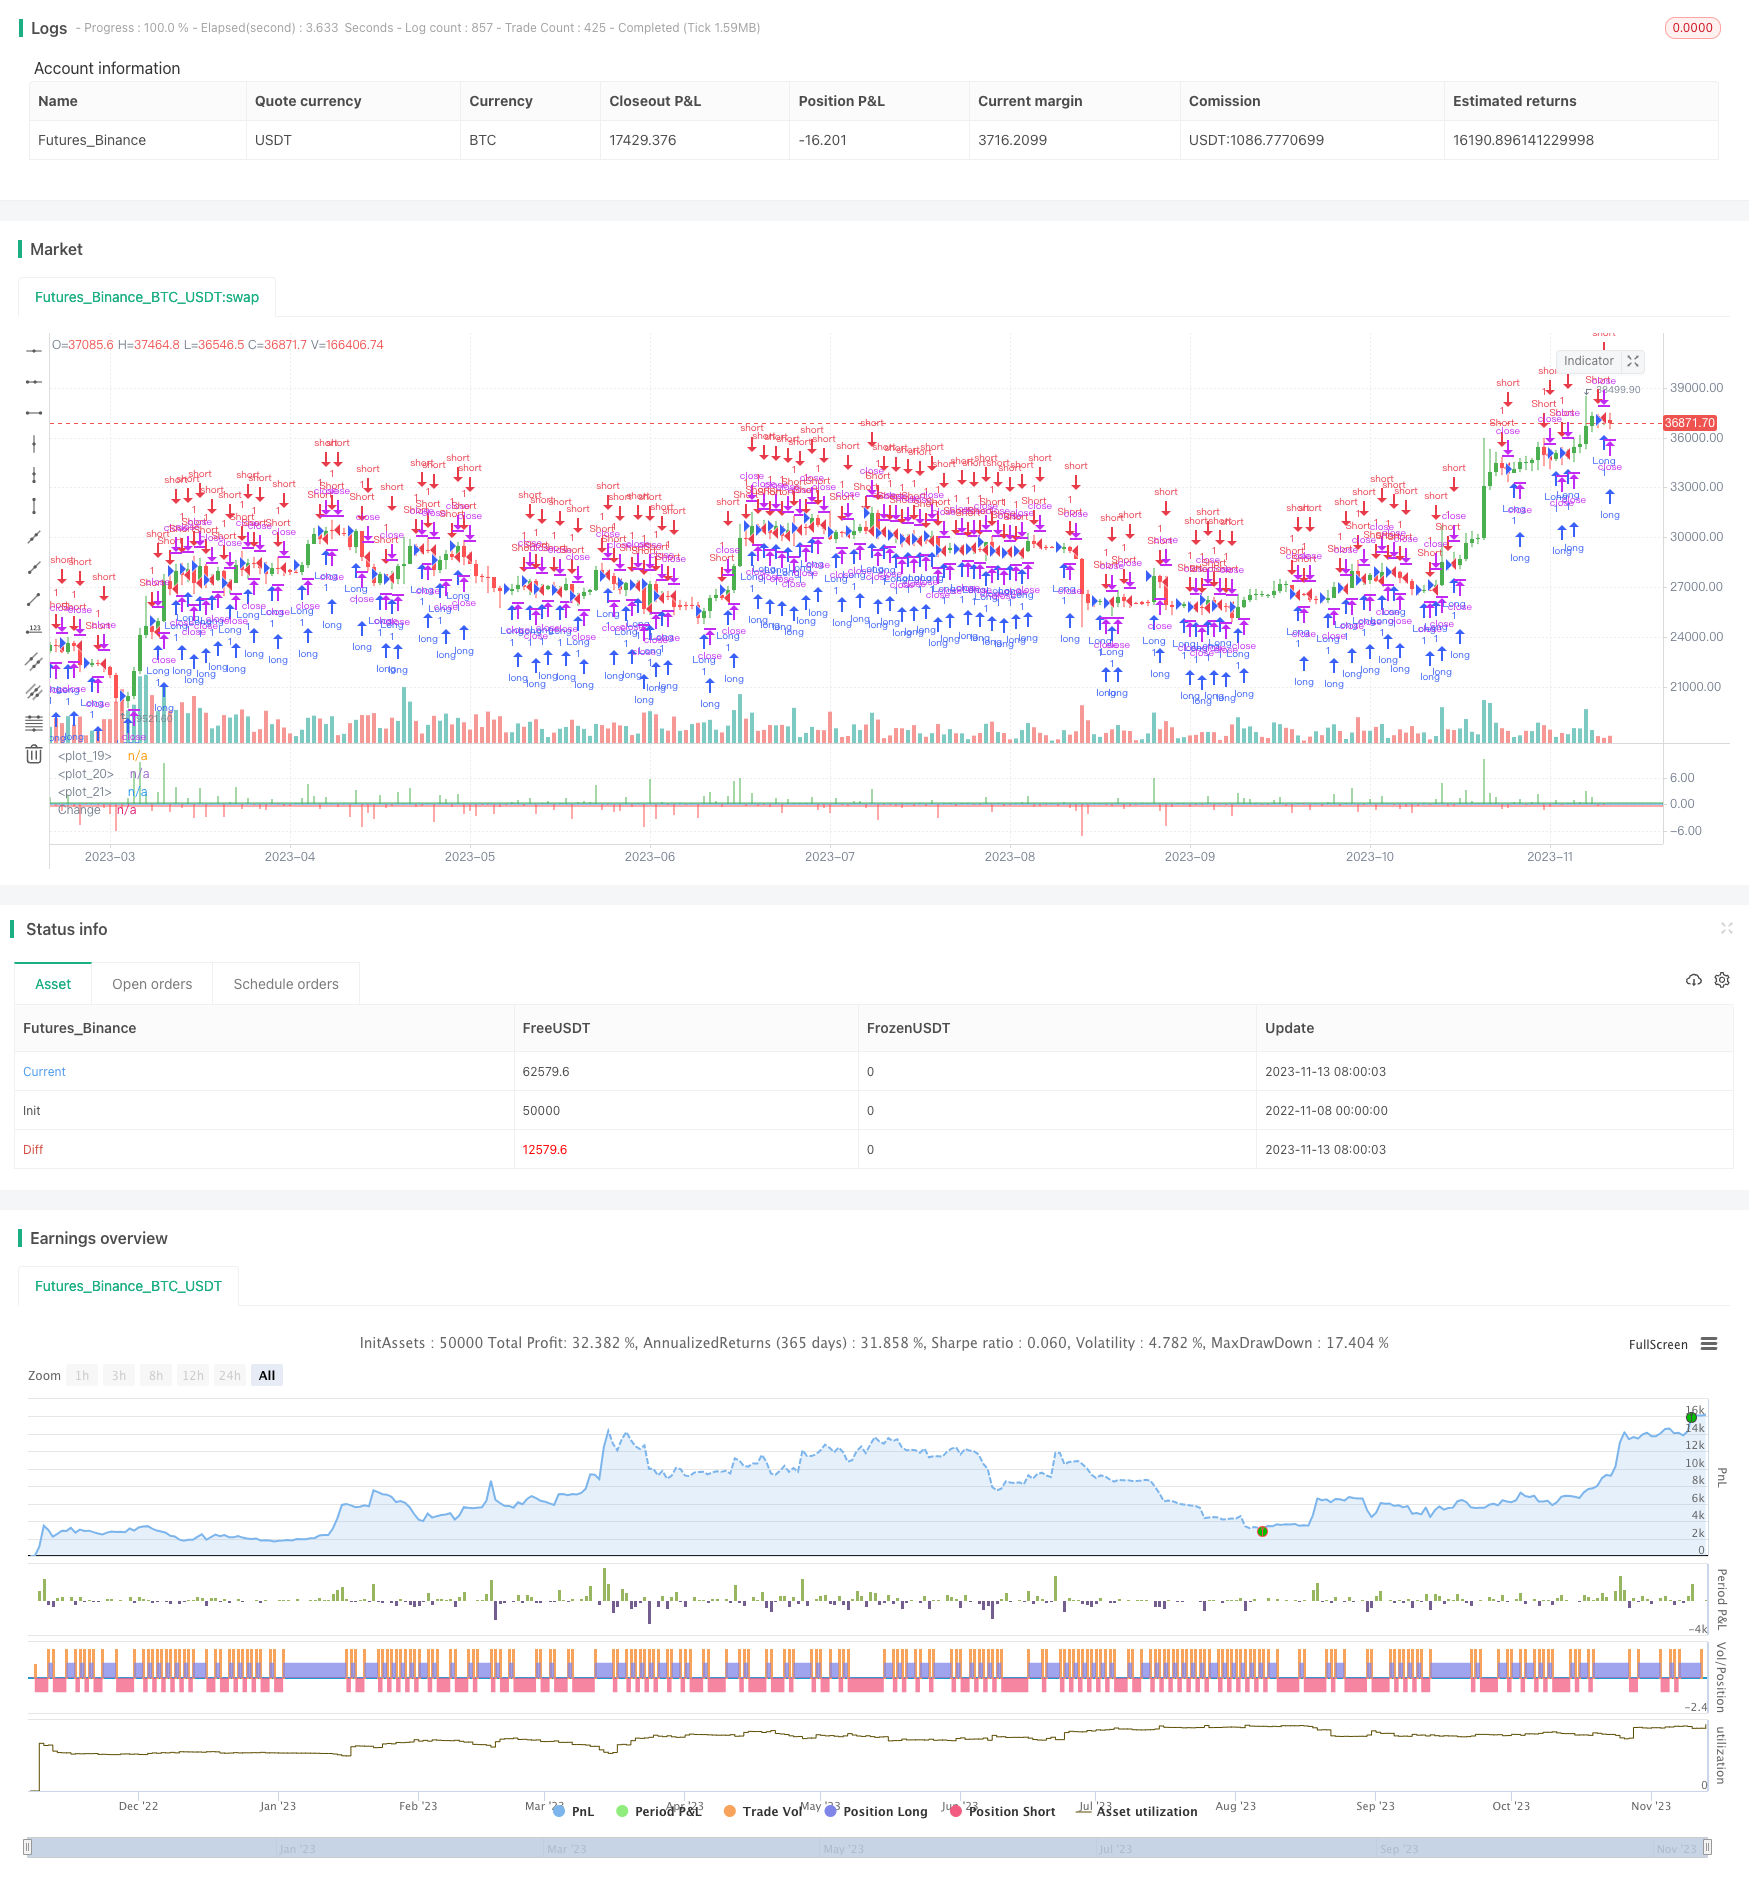
Overview
This strategy calculates the percentage change of the current bar’s closing price relative to the closing price N bars ago, and displays different colored histogram bars to determine the trend. It uses trend lines to determine entries and exits.
Strategy Logic
Set strategy parameters via input, including bar width, display price change or percentage change, lookback period, buy/sell thresholds etc.
Calculate the price difference or percentage difference between the current bar’s closing price and the closing price N bars ago.
Set buy and sell threshold lines.
Display histogram bars in different colors based on percentage change.
Set to long when percentage change is greater than buy threshold, and set to short when lower than sell threshold.
Color histogram bars according to position direction.
Enter and exit based on position direction.
Advantages
Intuitive display of price change trends for decision making.
Clear entry and exit signals in combination with trend indicators.
Parameters can be optimized for different products and timeframes.
Simple and clear logic, easy to understand and modify.
Good visualization for quick trend judgment.
Risks
Prone to false signals, improper entry selection may lead to losses.
Parameters need adjustment for high volatility products, otherwise increasing loss probability.
Unaccounted for sudden events like significant bearish news.
Short backtest period may be unable to determine robustness of parameters.
Missing reversal opportunities without stop time.
Risks can be controlled via parameter optimization, signal filtering with other indicators, stop loss, expanding backtest period etc.
Optimization Directions
Consider combining with other indicators like trend and volatility indicators to confirm signals.
Introduce machine learning algorithms to optimize parameter settings.
Set dynamic stop loss to control single loss amount.
Incorporate sentiment indicators and news to avoid sudden event impacts.
Add trading time or session filters.
Optimize backtest period with longer timeframe.
Summary
This strategy displays price change percentage in real-time with histogram bars and uses trendlines for decision making, forming clear trading signals. The logic is simple for easy operation. But risks exist and need to be controlled via optimization, filtering, stop loss etc. With continuous optimizations, it can become an easy to grasp and practical trend following strategy.
/*backtest
start: 2022-11-08 00:00:00
end: 2023-11-14 00:00:00
period: 1d
basePeriod: 1h
exchanges: [{"eid":"Futures_Binance","currency":"BTC_USDT"}]
*/

//@version=2
////////////////////////////////////////////////////////////
//  Copyright by HPotter v3.0 27/07/2018
//
//  This histogram displays price or % change from previous bar.
//
// You can change long to short in the Input Settings
// WARNING:
// - For purpose educate only
// - This script to change bars colors.
////////////////////////////////////////////////////////////
strategy(title="Percent change bar chart Backtest", precision = 2)
input_barwidth = input(4, title="Bar Width")
input_percentorprice = input(false, title="Price Change")
input_barsback = input(1, title="Look Back")
SellZone = input(-0.33, minval=0.01, step = 0.01)
BuyZone = input(0.33, minval=0.01, step = 0.01)
reverse = input(false, title="Trade reverse")
hline(0, color=blue, linestyle=line)
hline(BuyZone, color=green, linestyle=line)
hline(SellZone, color=red, linestyle=line)
xPrice = close
xPrice1 = iff(input_percentorprice, xPrice - xPrice[input_barsback], ((xPrice - xPrice[input_barsback]) * 100)/ xPrice[input_barsback])
colorg = iff(xPrice1 < 0, red, green)
pos = iff(xPrice1 > BuyZone, 1,
       iff(xPrice1 < SellZone, -1, nz(pos[1], 0)))
possig = iff(reverse and pos == 1, -1,
          iff(reverse and pos == -1, 1, pos))
if (possig == 1)
    strategy.entry("Long", strategy.long)
if (possig == -1)
    strategy.entry("Short", strategy.short)
barcolor(possig == -1 ? red: possig == 1 ? green : blue )
plot(xPrice1, color=colorg, style = histogram, linewidth = input_barwidth, title="Change")