Dynamic Oscillation Breakout Strategy
Author: ChaoZhang, Date: 2023-11-16 15:40:25Tags:

Overview
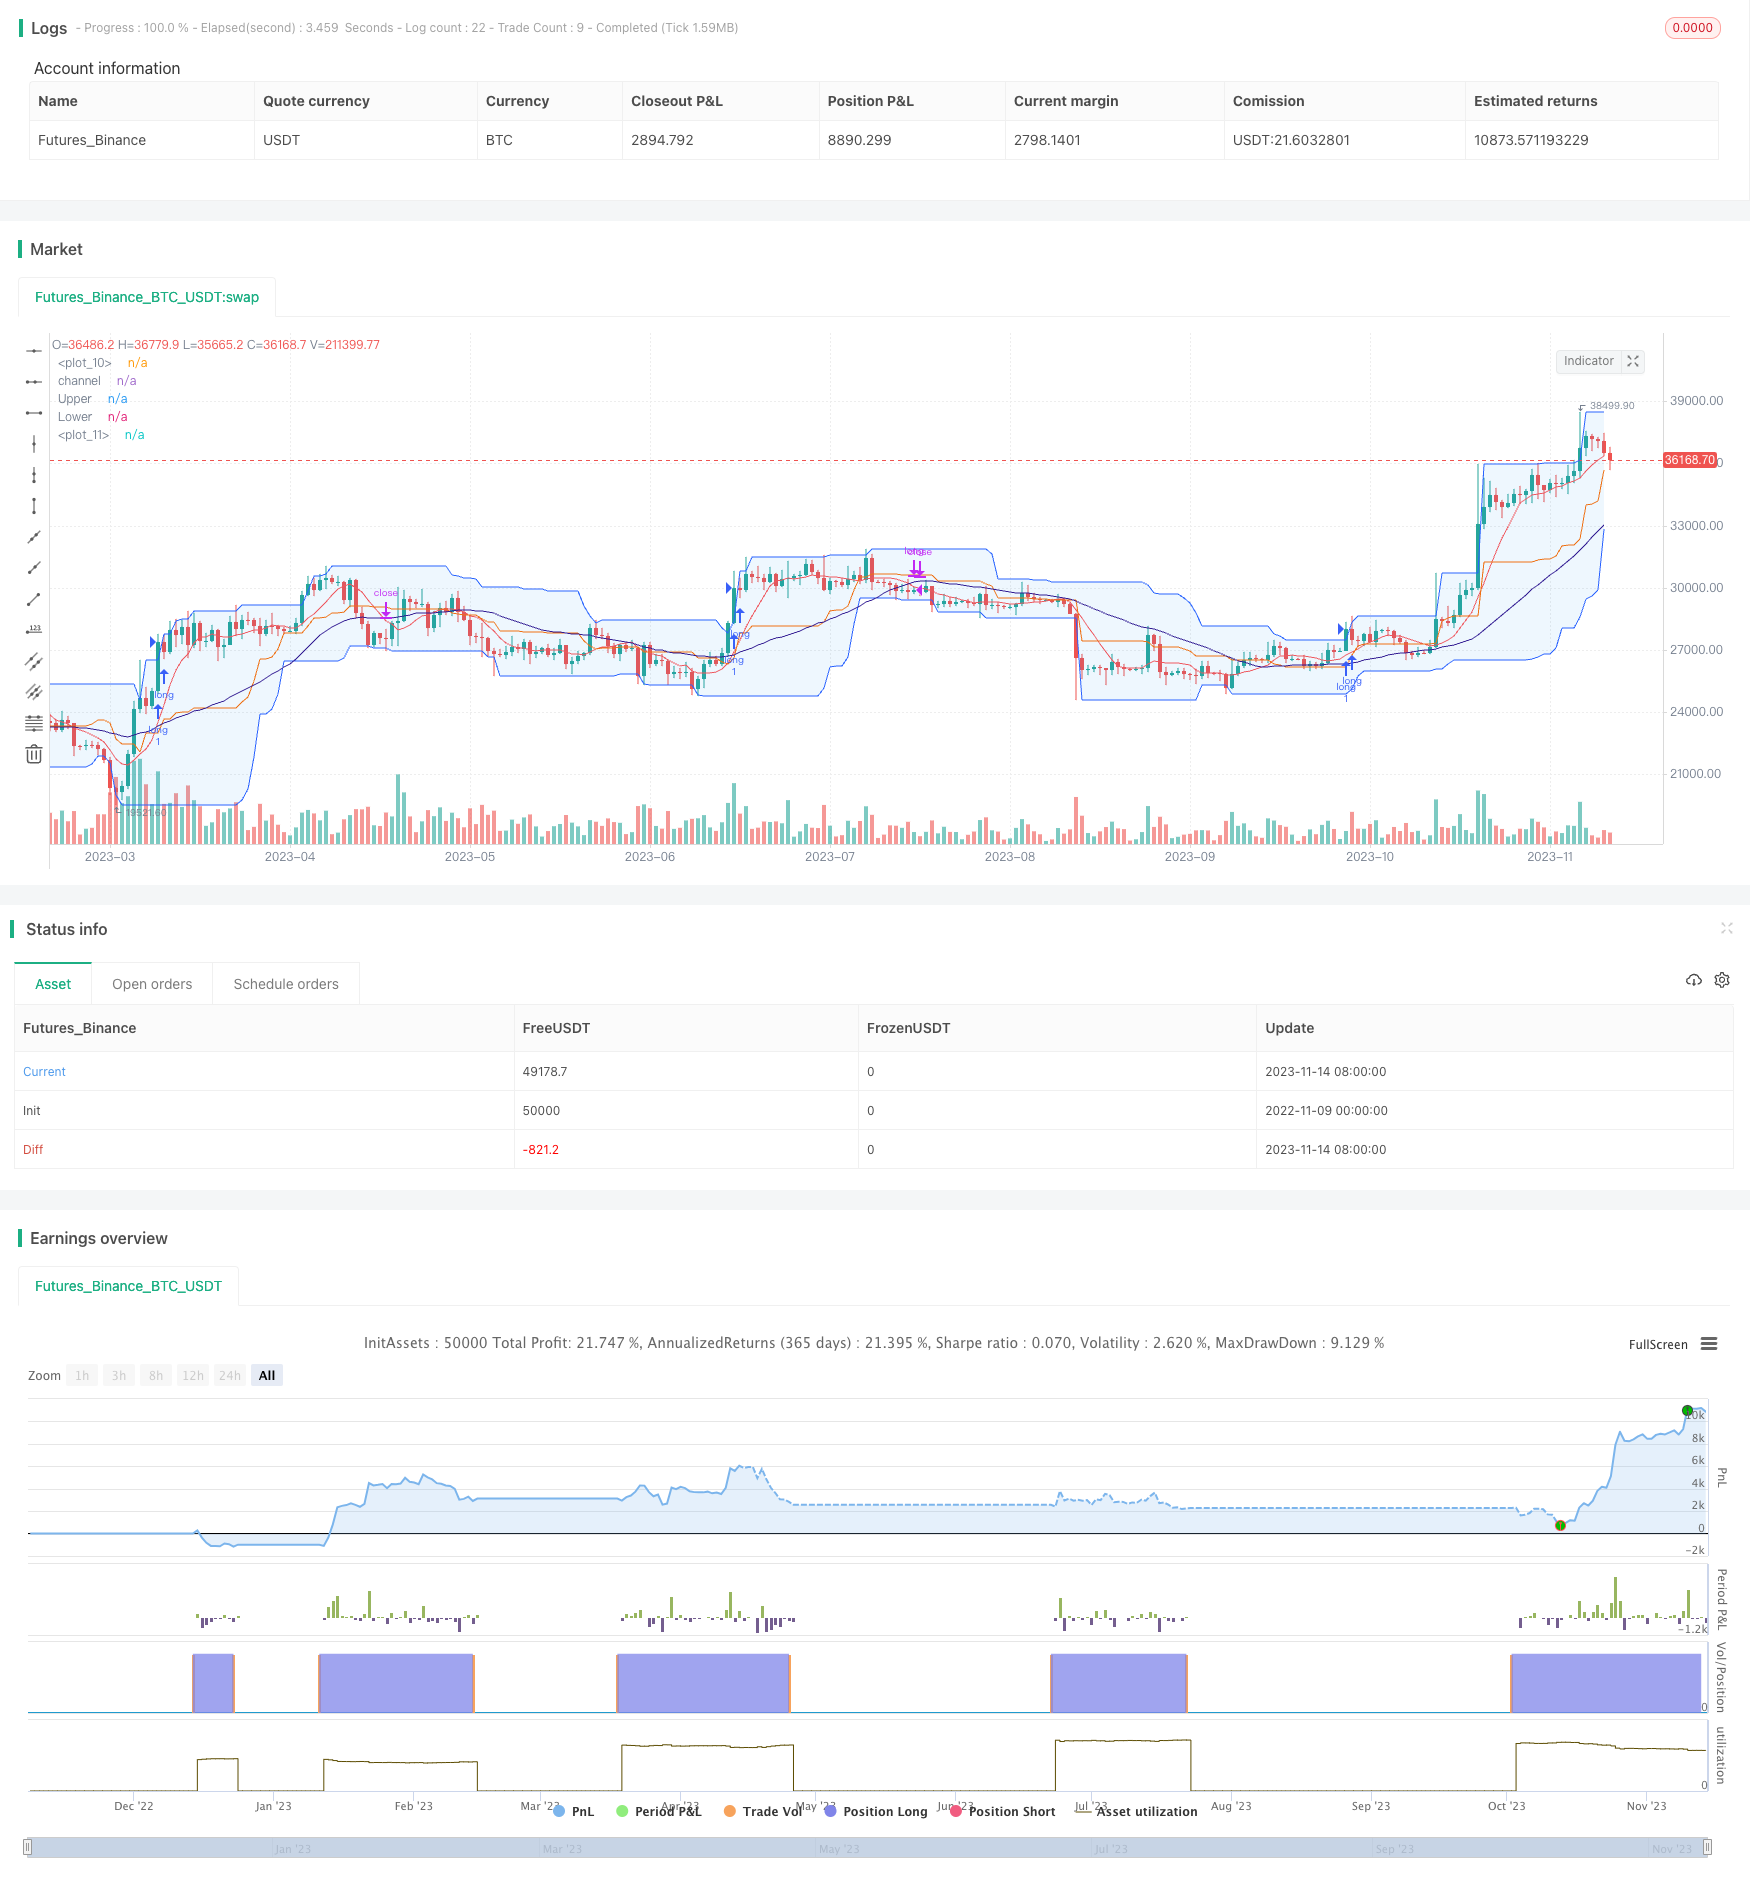
This strategy adopts dynamic oscillation channel breakout to determine entry and stop loss points based on price movement. The strategy is simple and suitable for momentum stocks.
Strategy Logic
The strategy first calculates the highest high and lowest low over the past 20 days to obtain a dynamic oscillation channel. Then it calculates the 8-day and 32-day exponential moving averages. When the closing price breaks through the upper band of the channel and the 8-day EMA is above the 32-day EMA, it goes long. When the price breaks through the lower band or the 8-day EMA crosses below the 32-day EMA, it exits. The stop loss is set below the middle band of the channel.
Specifically, the entry conditions are:
-
The closing price breaks through the dynamic upper band formed by the highest high over past 20 days.
-
The 8-day EMA is above the 32-day EMA.
The exit conditions are:
-
Stop loss triggered when price drops below the middle band.
-
The 8-day EMA crosses below the 32-day EMA.
The strategy identifies trend direction using the dynamic channel and current uptrend status using the EMA crossover. This helps control risk.
Advantages
- Dynamic channel breakout identifies trend direction effectively, avoiding whipsaws.
- 8-day and 32-day EMA crossover filters trades well.
- Simple and clear rules, easy to understand.
- Reasonable stop loss mechanism.
Risks
- Failed breakout may cause losses.
- Improper parameter tuning of channel range may cause it to be too wide or too narrow.
- Improper EMA periods may impact performance.
- Stop loss too tight may cause excessive stops.
The risks can be managed by optimizing channel period, EMA periods, and stop loss positioning.
Improvement Areas
- Optimize channel period for different stocks.
- Test different EMA combinations to find optimal periods.
- Incorporate volume to confirm breakouts.
- Trail stop loss after entry.
Summary
The dynamic oscillation breakout strategy has clear logic to identify trend and enter based on channel breakout and EMA crossover. The stop loss helps control risk. Parameter tuning such as channel period and EMA periods can improve profit factor. This strategy works well for stocks with continuation patterns, especially breaking previous highs.
/*backtest
start: 2022-11-09 00:00:00
end: 2023-11-15 00:00:00
period: 1d
basePeriod: 1h
exchanges: [{"eid":"Futures_Binance","currency":"BTC_USDT"}]
*/

// This source code is subject to the terms of the Mozilla Public License 2.0 at https://mozilla.org/MPL/2.0/
// © Robrecht99

//@version=5
strategy("My Strategy", overlay=true, margin_long=100, margin_short=100)

fast = ta.sma(close, 8)
slow = ta.sma(close, 32)

plot(fast, color=color.red)
plot(slow, color=color.navy)

entrycondition1 = ta.crossover(fast, slow)
entrycondition2 = fast > slow
sellcondition1 = ta.crossunder(fast, slow)
sellcondition2 = slow > fast

atr = ta.atr(14)

//Donchian Channels
days = 20
h1 = ta.highest(high[1], days)
l1 = ta.lowest(low[1], days)
mid = math.avg(h1, l1)
plot(mid, "channel", color=#FF6D00)
u = plot(h1, "Upper", color=#2962FF)
l = plot(l1, "Lower", color=#2962FF)
fill(u, l, color.new(color.blue, 90))

if (close > h1 and entrycondition2)
    strategy.entry("long", strategy.long)
    stoploss = close - atr * 3
    trail = close - atr * 3
    strategy.exit("exit", "long", stop=stoploss, trail_offset=trail)
if (sellcondition1 and sellcondition2)
    strategy.close(id="long")
- Mean Reversion Trading Strategy Based on Bollinger Bands and Golden Ratio
- Momentum Trend Following Oscillation Strategy
- WaveTrend and CMF Based Trend Following Strategy
- Adaptive Bollinger Trend Tracking Strategy
- Multi-Timeframe RSI Moving Average Crossover Strategy
- Trend Breakout Strategy Based on Bollinger Bands
- Adaptive Regularized Moving Average Cross-Market Arbitrage Strategy
- Dual Strong Trend Tracking Stop Loss Strategy
- Momentum Indicator Strategy
- Heikin-Ashi Reverse Strategy
- Trend Following 5-Minute EMA Crossover Strategy
- RSI Trend Following Strategy
- RSI Divergence Strategy
- Quantized Gradual Weighted DCA Trading Strategy
- Dual Moving Average Deviation Combined with ATR Indicator Trend Following Strategy
- Multi Trend Strategy
- Break-even Price Strategy
- Trend Following Short-term Trading Strategy
- BB21_SMA200 Trend Following Strategy
- Momentum Ichimoku Cloud Trading Strategy