概述
多时间框架RSI均线交叉策略是一种多时间框架的趋势跟踪策略。该策略同时使用多个时间框架的RSI指标,并对每个时间框架的RSI进行加权移动平均处理,最终合并为两个综合信号指标,当两个信号指标发生金叉时做多,发生死叉时做空,属于典型的双均线交叉策略。
原理
该策略首先在多个时间框架(1分钟、5分钟、15分钟等)分别计算RSI指标,然后对每个时间框架的RSI进行长度为15的加权移动平均(VMA)处理,得到各个时间框架的RSI均线。
之后,把所有时间框架的RSI均线进行等权重合并,分别合并成快线和慢线两个信号。快线长度为100周期的EMA,慢线长度为150周期的EMA。
当快线从下向上突破慢线时产生买入信号;当快线从上向下突破慢线时产生卖出信号。这样,多时间框架RSI的综合交叉信号,可以有效跟踪趋势,同时过滤掉短期市场噪音。
优势
多时间框架综合,可以平滑价格曲线,有效过滤假突破。
RSI指标可以反映超买超卖状态,避免追高杀跌。
双均线较单一均线系统有更好的持仓效果。
采用VMA而不是SMA,可以降低短期波动对均线的影响。
风险
多时间框架策略,对参数调优要求较高,不当设置可能进场过早或过晚。
均线系统对曲线拟合效果不佳,在趋势转折点表现较差。
RSI指标容易形成背离,应注意反转信号。
解决方法:调整时间框架参数设置;结合其他指标判断趋势,如MACD等;警惕RSI背离信号出现。
优化方向
优化时间框架的数量及参数设置,使之更好地捕捉趋势。
考虑加入止损机制,以控制风险。
结合其他指标判断趋势和背离,提高决策质量。
测试不同持仓周期参数,寻找最佳持仓效果。
总结
多时间框架RSI均线交叉策略通过多个时间范围内RSI指标的综合判断,利用均线系统平滑价格曲线并产生交易信号,属于典型的多时间框架趋势跟踪策略。该策略优势在于可以有效跟踪趋势同时过滤噪音,但需要注意参数调优和风险控制。通过进一步优化,该策略可以成为一个较强的趋势跟踪体系。
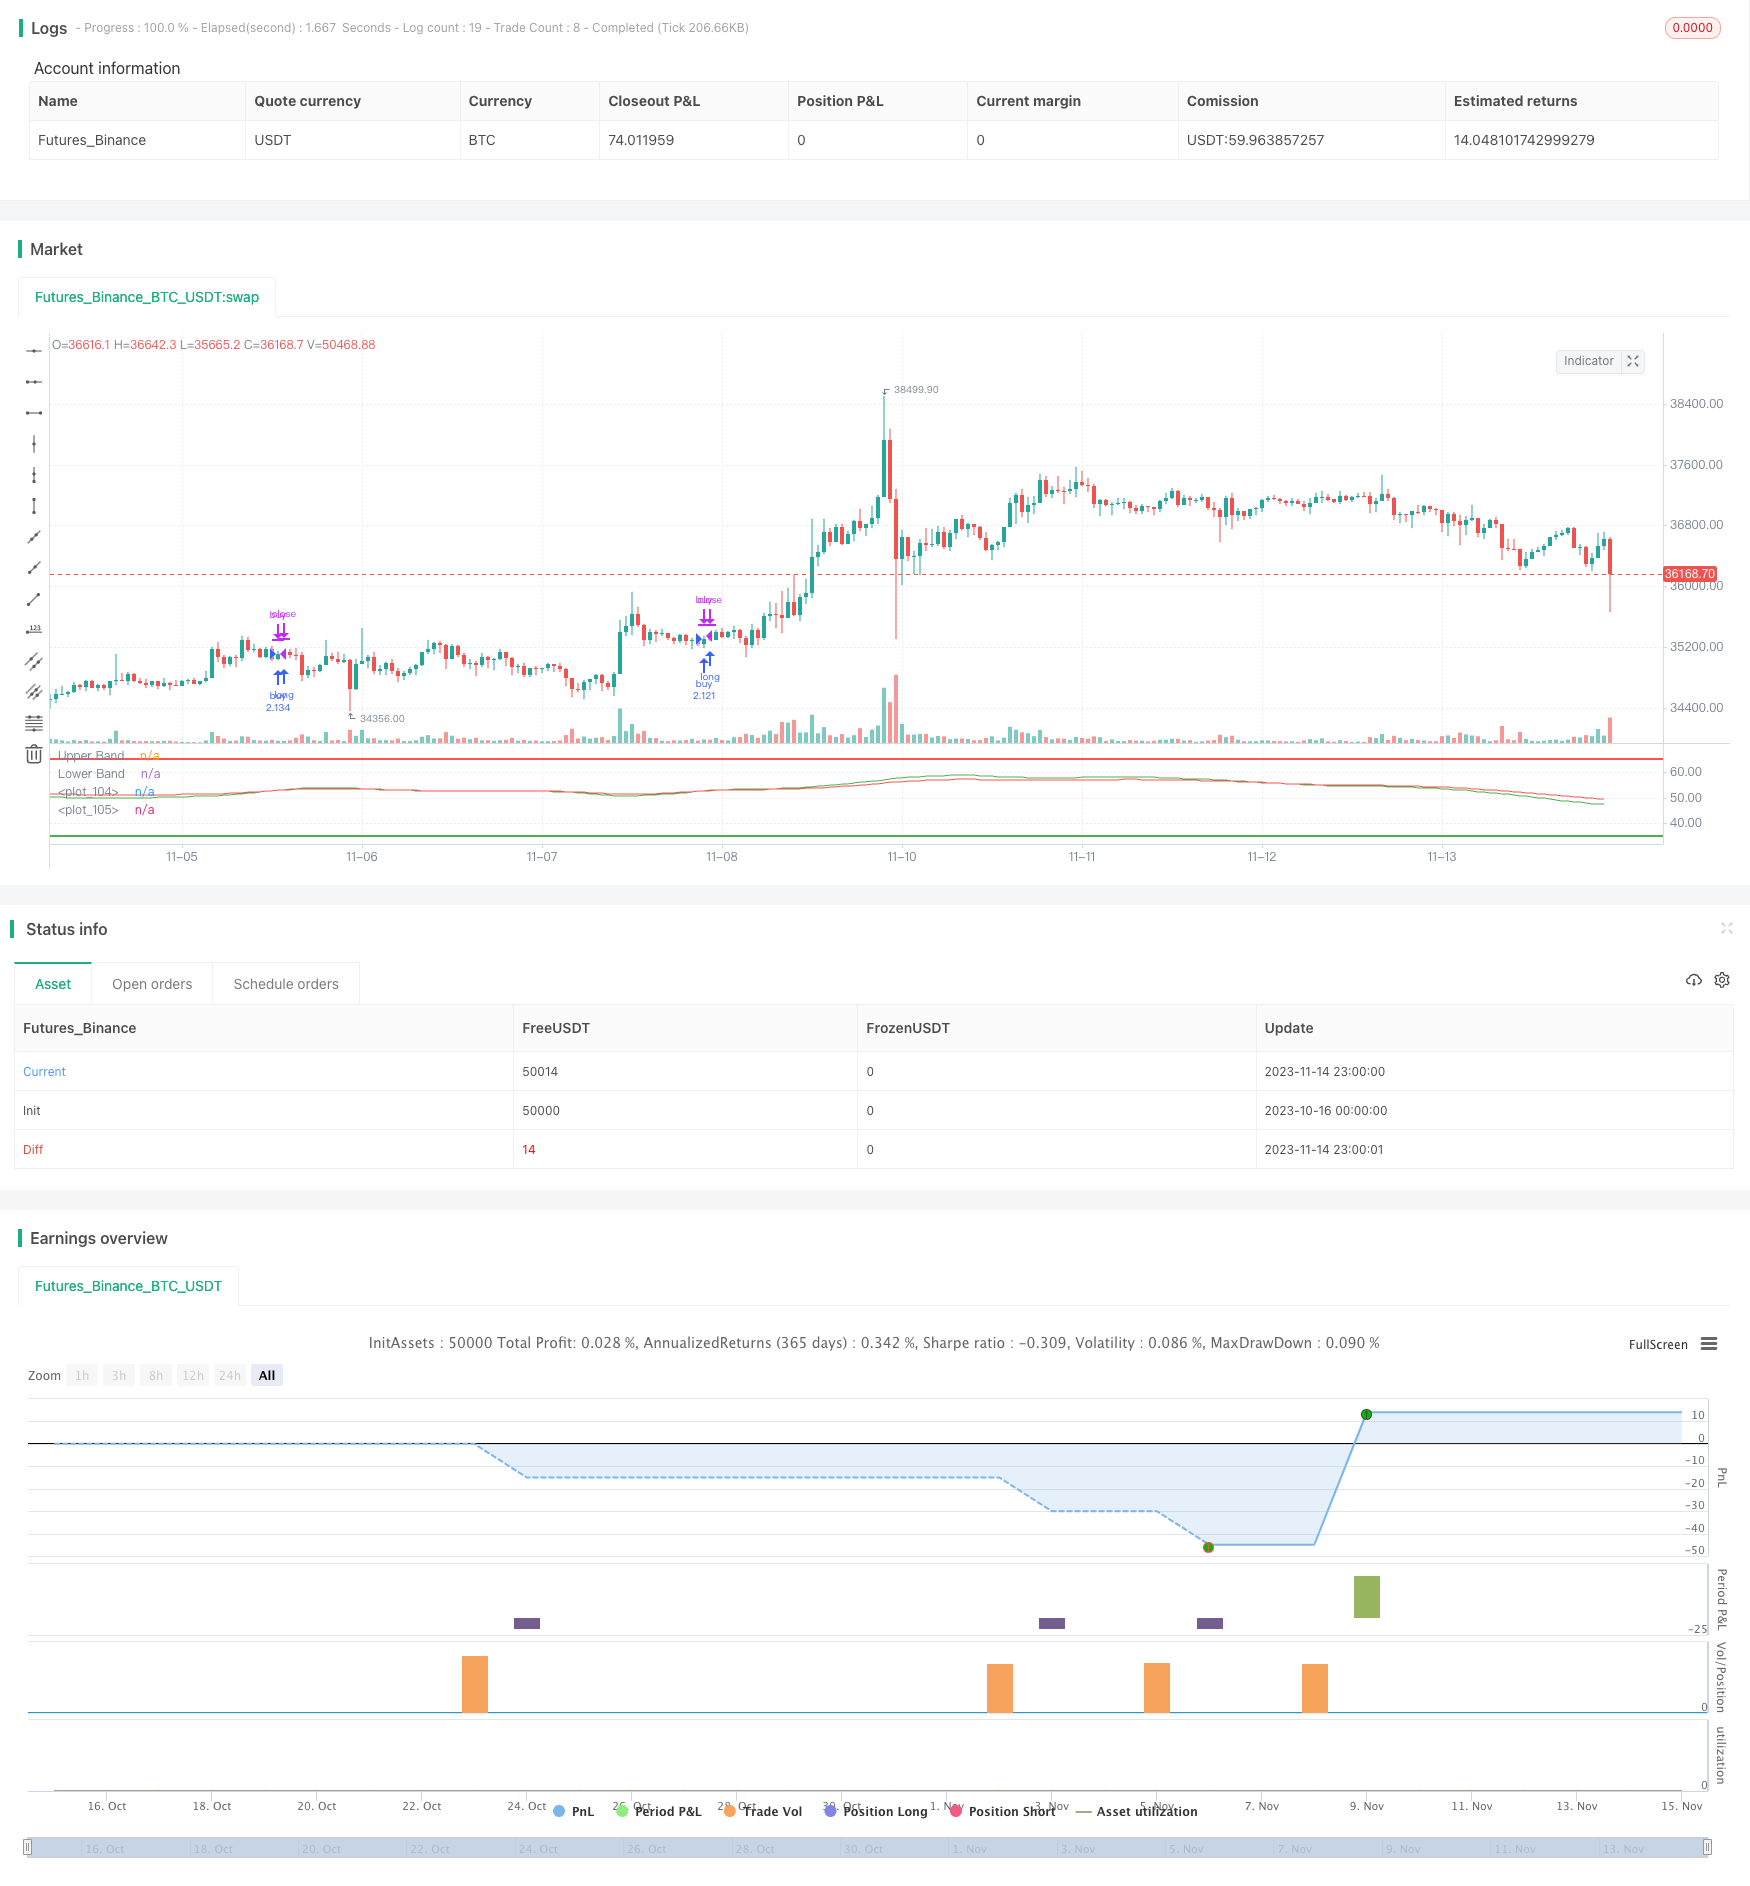
/*backtest
start: 2023-10-16 00:00:00
end: 2023-11-15 00:00:00
period: 1h
basePeriod: 15m
exchanges: [{"eid":"Futures_Binance","currency":"BTC_USDT"}]
*/

//@version=4
strategy(title="RSI multitimeframe SMA crossover", shorttitle="RSI multitimeframe strategy", default_qty_type= strategy.percent_of_equity, margin_long=50, default_qty_value=150)

res1 = input(title="Res 01", type=input.resolution, defval="1")
res2 = input(title="Res 0", type=input.resolution, defval="5")
res3 = input(title="Res 1", type=input.resolution, defval="15")
res4 = input(title="Res 2", type=input.resolution, defval="15")
res5 = input(title="Res 3", type=input.resolution, defval="15")
res6 = input(title="Res 4", type=input.resolution, defval="30")
res7 = input(title="Res 5", type=input.resolution, defval="45")
res8 = input(title="Res 6", type=input.resolution, defval="60")


lengthRSI = input(15, minval=1)
lengthMA = input(15, minval=1)
lengthFMA = input(100, minval=1)
lengthFMA2 = input(150, minval=1)
Long_yes = input(defval=1, title="Long trades 0 or 1", minval=0, maxval=1)
Short_yes = input(defval=0, title="Short trades 0 or 1", minval=0, maxval=1)
src = close

// === INPUT BACKTEST RANGE ===
fromMonth = input(defval = 1,    title = "From Month",      type = input.integer, minval = 1, maxval = 12)
fromDay   = input(defval = 1,    title = "From Day",        type = input.integer, minval = 1, maxval = 31)
fromYear  = input(defval = 2020, title = "From Year",       type = input.integer, minval = 1970)
thruMonth = input(defval = 1,    title = "Thru Month",      type = input.integer, minval = 1, maxval = 12)
thruDay   = input(defval = 1,    title = "Thru Day",        type = input.integer, minval = 1, maxval = 31)
thruYear  = input(defval = 2112, title = "Thru Year",       type = input.integer, minval = 1970)

// === INPUT SHOW PLOT ===
showDate  = input(defval = true, title = "Show Date Range", type = input.bool)

// === FUNCTION EXAMPLE ===
start     = timestamp(fromYear, fromMonth, fromDay, 00, 00)        // backtest start window
finish    = timestamp(thruYear, thruMonth, thruDay, 23, 59)        // backtest finish window
window()  => time >= start and time <= finish ? true : false       // create function "within window of time"


// stop loss
longLossPerc = input(title="Long Stop Loss (%)", type=input.float, minval=0.0, step=0.5, defval=10) *
   0.01
longStopPrice = strategy.position_avg_price * (1 - longLossPerc)

shortLossPerc = input(title="Short Stop Loss (%)", type=input.float, minval=0.0, step=0.5, defval=10) *
   0.01
shortStopPrice = strategy.position_avg_price * (1 + shortLossPerc)


rsi1 = rsi(src, lengthRSI)
MA1 = vwma(rsi1, lengthMA)


outD1 = security(syminfo.tickerid, res1, MA1)
outD2 = security(syminfo.tickerid, res2, MA1)
outD3 = security(syminfo.tickerid, res3, MA1)
outD4 = security(syminfo.tickerid, res4, MA1)
outD5 = security(syminfo.tickerid, res5, MA1)
outD6 = security(syminfo.tickerid, res6, MA1)
outD7 = security(syminfo.tickerid, res7, MA1)
outD8 = security(syminfo.tickerid, res8, MA1)


//plot_d0 = outD0
//plot_d1 = outD1
//plot_d2 = outD2
//plot_d3 = outD3
//plot_d4 = outD4
//plot_d5 = outD5
//plot_d6 = outD6

out_multi = ema(outD1+outD2+outD3+outD4+outD5+outD6+outD7+outD8, lengthFMA)
out_multi2 = ema(outD1+outD2+outD3+outD4+outD5+outD6+outD7+outD8, lengthFMA2)
//out_multi1 = outD2+outD3+outD4
//out_multi2 = outD4+outD5+outD6

//col0 = outD0 < 20 ? color.lime : outD0 > 80 ? color.red : color.blue
//col1 = outD1 < 20 ? color.lime : outD1 > 80 ? color.red : color.blue
//col2 = outD2 < 20 ? color.lime : outD2 > 80 ? color.red : color.blue
//col3 = outD3 < 20 ? color.lime : outD3 > 80 ? color.red : color.blue
//col4 = outD4 < 20 ? color.lime : outD4 > 80 ? color.red : color.blue
//col5 = outD5 < 20 ? color.lime : outD5 > 80 ? color.red : color.blue
//col6 = outD6 < 20 ? color.lime : outD6 > 80 ? color.red : color.blue


// plot(plot_d0,linewidth=2, color=col0)
// plot(plot_d1, linewidth=2, color=col1)
// plot(plot_d2,linewidth=2, color=col2)
// plot(plot_d3,linewidth=2, color=col3)
// plot(plot_d4,linewidth=2, color=col4)
// plot(plot_d5,linewidth=2, color=col5)
// plot(plot_d6,linewidth=2, color=col6)

long=(out_multi/8)
short=(out_multi2/8)

plot(long, linewidth=1, color=color.green)
plot(short, linewidth=1, color=color.red)

long1=crossover(long,short)
short1=crossunder(long,short)

h0 = hline(65, "Upper Band", color=color.red, linestyle=hline.style_solid, linewidth=2 )
h1 = hline(35, "Lower Band", color=color.green, linestyle=hline.style_solid, linewidth=2)


strategy.entry("buy", strategy.long, when=long1 and window() and Long_yes > 0)
if strategy.position_size > 0
    strategy.exit(id="XL STP", stop=longStopPrice)
strategy.close("buy",when=short1 )

strategy.entry("sell", strategy.short, when=short1 and window() and Short_yes > 0)
if strategy.position_size < 0
    strategy.exit(id="XS STP", stop=shortStopPrice)
strategy.close("buy",when=long1 )