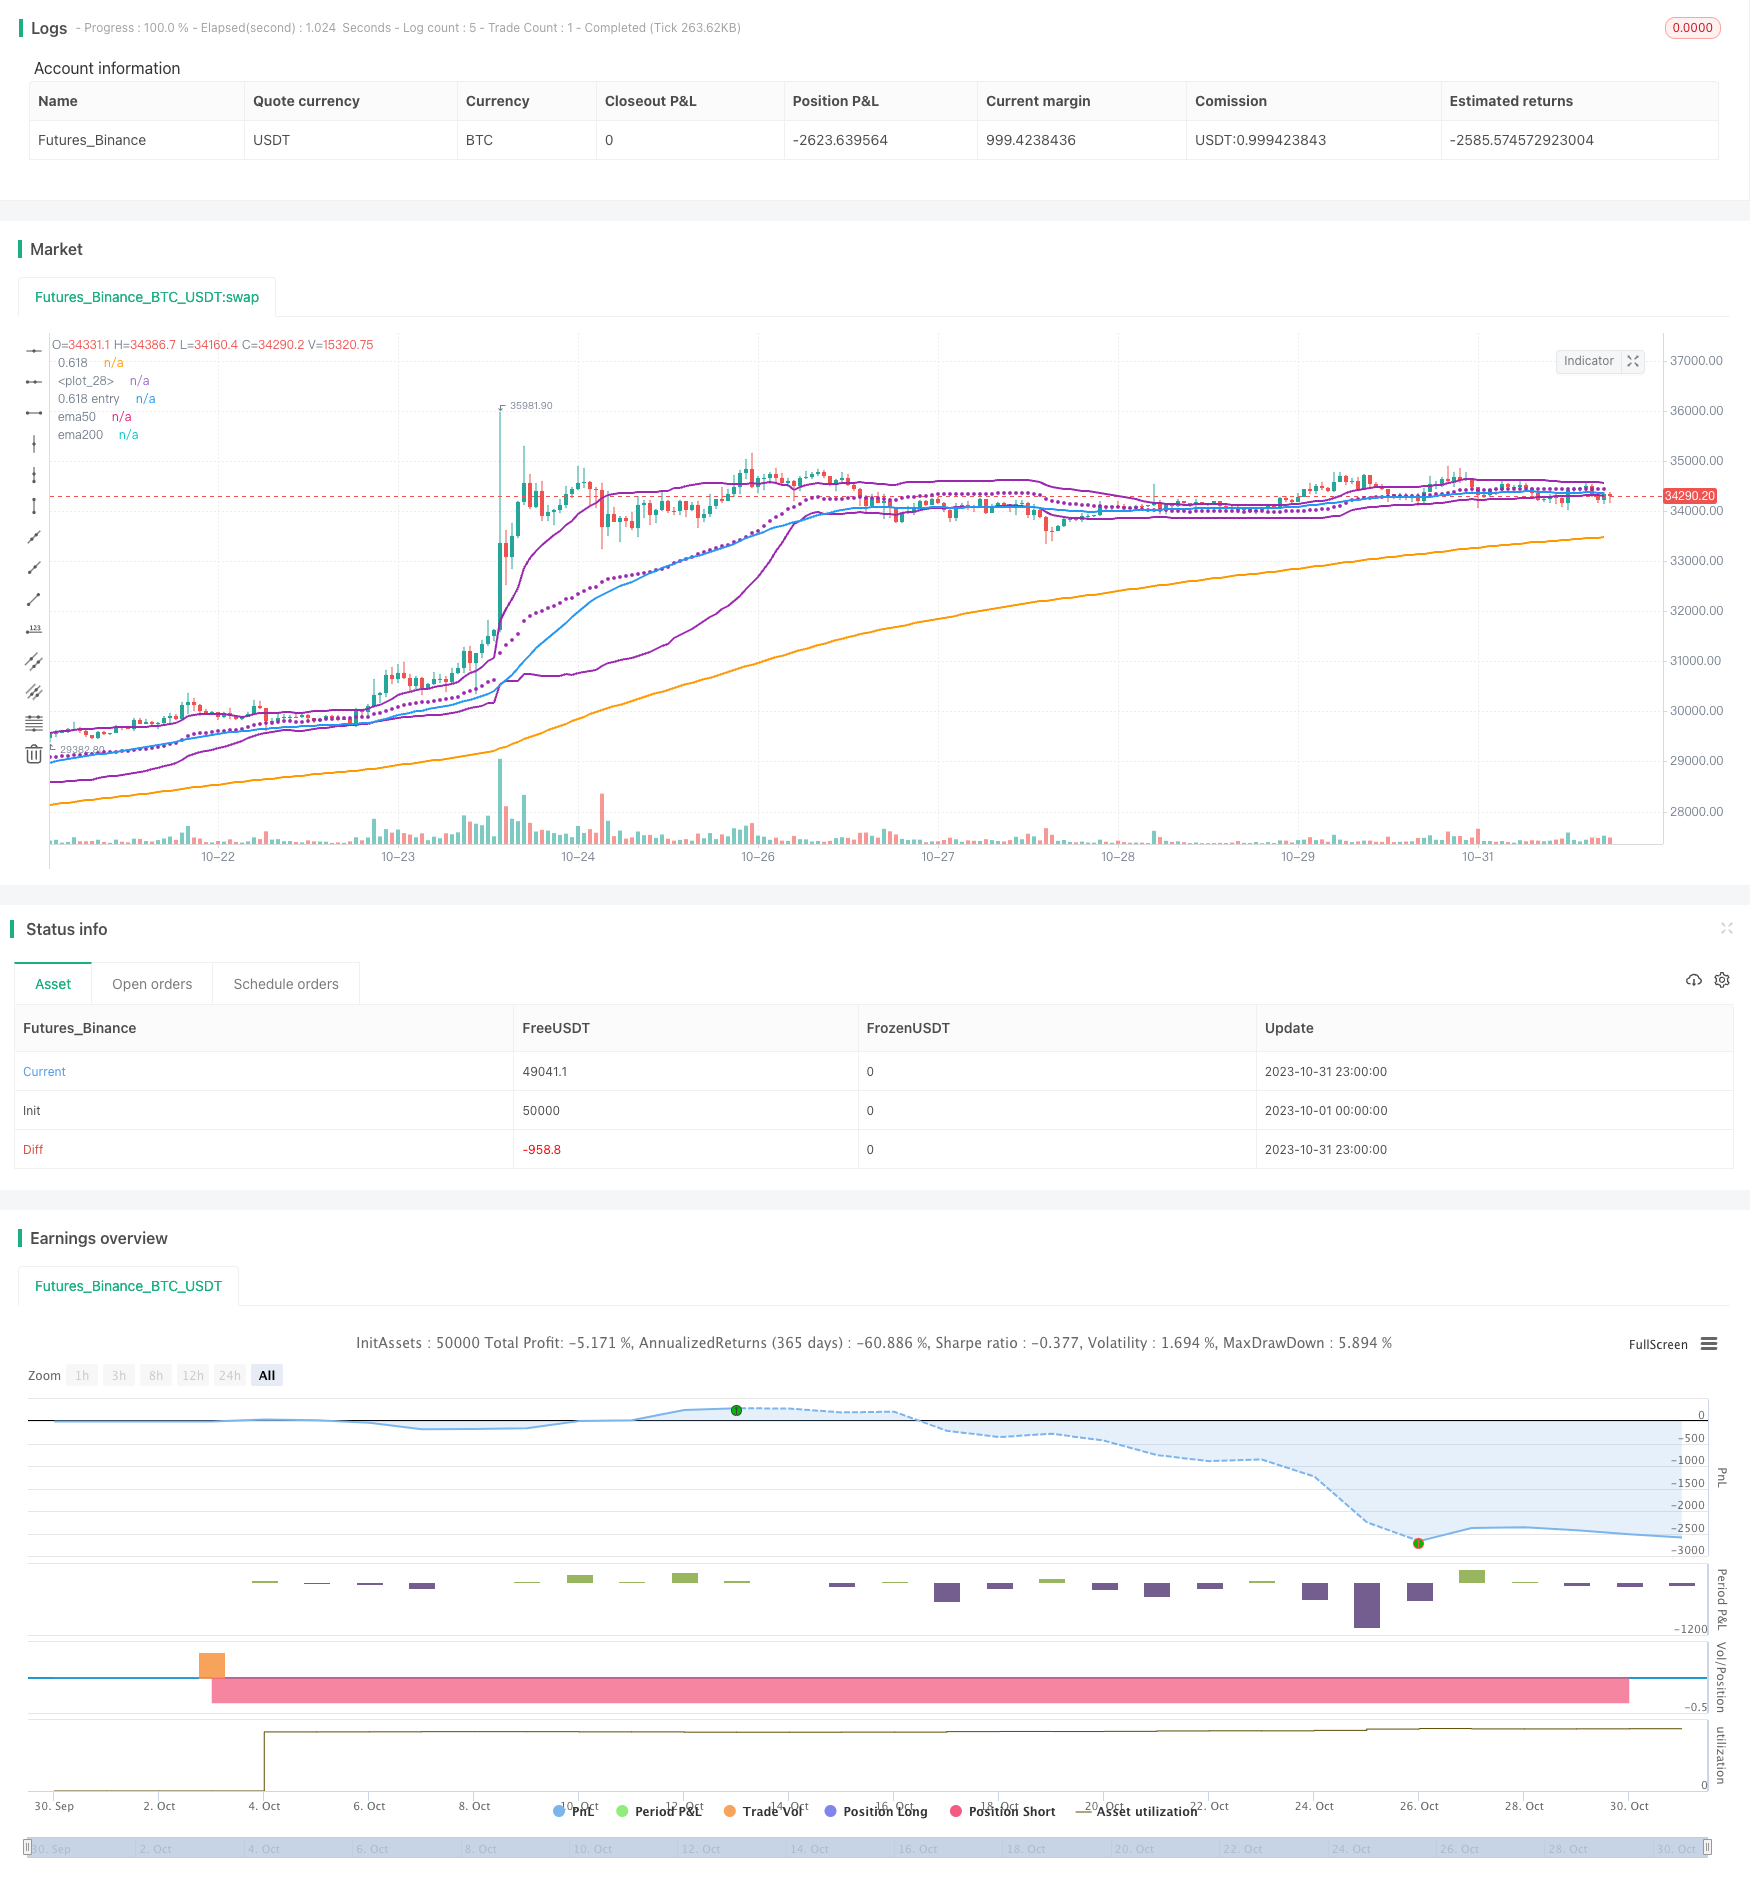
Mean Reversion Trading Strategy Based on Bollinger Bands and Golden Ratio
Author: ChaoZhang, Date: 2023-11-16 16:52:55Tags:

Overview
This strategy uses the golden ratio line of Bollinger Bands combined with moving average formations to trade mean reversions. When the price touches the golden ratio line, it is considered a buy signal to take advantage of the mean reverting tendency.
Strategy Logic
- Calculate Bollinger Bands middle band, upper band and golden ratio lower band
- Middle band: vwma of n periods
- Upper band: Middle band + k * n period standard deviation
- Golden ratio lower band: Middle band - 0.618 * n period standard deviation
- Judge formations
- 50-day MA above 200-day MA, indicates uptrend
- Price touches or below golden ratio lower band, as buy signal
- Exit
- When price breaks above BB upper band, price is considered to have moved away from lower band, close position
- Stop loss
- Set fixed percentage stop loss, e.g. 5%
Advantages
-
Using vwma instead of sma for BB middle line better reflects price movement
-
Golden ratio is important support/resistance, provides basis for reversion
-
MA in uptrend ensures overall trend is up
-
Fixed stop loss controls loss for each trade
Risks
-
Golden ratio line is not guaranteed support, price may break through
-
Fixed stop loss may be arbitrary, should consider adjusting based on volatility
-
MA uptrend may be false breakout, should check more indicators
-
Unsure of reversion length, need reasonable profit taking exit
Enhancement
-
Test different combinations of parameters like BB period, SD multiplier, fixed stop loss percentage etc.
-
Add more indicators to determine market trend and reversion probability, e.g. MACD, KD etc.
-
Consider dynamic stops, such as ATR or trailing stops
-
Optimize profit taking like moving profit stop, partial profit taking etc.
Summary
This strategy trades mean reversions using BB golden ratio line, with clear logic, simple parameters, and controllable drawdown. But also has risks, requires further testing and optimization, adding more technical indicators for trend and better stops/exits before actual use. Overall provides idea of using golden ratio in quant trading, worth exploring further.
/*backtest
start: 2023-10-01 00:00:00
end: 2023-10-31 23:59:59
period: 1h
basePeriod: 15m
exchanges: [{"eid":"Futures_Binance","currency":"BTC_USDT"}]
*/

// This source code is subject to the terms of the Mozilla Public License 2.0 at https://mozilla.org/MPL/2.0/
// © mohanee

//@version=4

strategy(title="Bollinger Band with Fib Golden Ratio (0.618)",  shorttitle="Bollinger Band with Fib Golden Ratio" , overlay=true, pyramiding=1,     default_qty_type=strategy.percent_of_equity,  default_qty_value=20, initial_capital=10000, currency=currency.USD)

length = input(50,title="BB Length" , minval=1)
src1 = input(hlc3, title="Source")
//mult1 = input(1.33, minval=0.001, maxval=50)
mult = input(1.5,title="multplier", minval=0.001, maxval=50)

stopLoss=input(5,title="Stop Loss",minval=1)

basis = vwma(src1, length)
dev = mult * stdev(src1, length)

//dev3 = mult3 * stdev(src, length)

upper_618= basis + (0.618*dev)
lower_618= basis - (0.618*dev)

//lower_618_dev3= basis - (0.618*dev3)


plot_upper618= plot(upper_618, color=color.purple, linewidth=2, title="0.618")
plot(basis, color=color.purple,style=plot.style_circles,  linewidth=2)

plot_lower618= plot(lower_618, color=color.purple, linewidth=2, title="0.618 entry")
//plot_lower618_dev3= plot(lower_618_dev3, color=color.red, linewidth=1, title="0.618 stop")

//plot_lower618= plot(lower_618, color=color.purple, linewidth=1, title="0.618 entry")

ema200=ema(close,200)
ema50=ema(close,50)

plot (ema200, title="ema200", color=color.orange, linewidth=2)
plot (ema50, title="ema50", color=color.blue , linewidth=2)


longCondition= ema50 > ema200

strategy.entry(id="BB_Fib618", long=true, when = longCondition and ( close < lower_618  or  low <= lower_618)  )

strategy.close(id="BB_Fib618",  comment="points="+tostring(close - strategy.position_avg_price,  "###.##") , when = strategy.position_size >= 1  and crossover(close,upper_618 ))

//stoploss exit
stopLossVal = strategy.position_size>=1 ?  strategy.position_avg_price * ( 1 - (stopLoss/100) ) : 0.00
strategy.close(id="BB_Fib618", comment="SL="+tostring(close - strategy.position_avg_price,  "###.##"), when=abs(strategy.position_size)>=1 and close < stopLossVal ) //and close > strategy.position_avg_price )
- MACD Trend Following Strategy
- Dual-track Bollinger Band Momentum Trading Strategy
- Ichimoku Kinko Hyo Trading Strategy
- MZ MA Cross Multiple TimeFrame Strategy
- Dual Moving Average Crossover Momentum Strategy
- Dual Moving Average Tracking Stop Loss Strategy
- Candlestick Body Based Dual Thrust Strategy
- Fixed Grid Trading Strategy
- Relative Strength Index Long/Short Strategy
- Dual Momentum Breakout Strategy
- Momentum Trend Following Oscillation Strategy
- WaveTrend and CMF Based Trend Following Strategy
- Adaptive Bollinger Trend Tracking Strategy
- Multi-Timeframe RSI Moving Average Crossover Strategy
- Trend Breakout Strategy Based on Bollinger Bands
- Adaptive Regularized Moving Average Cross-Market Arbitrage Strategy
- Dual Strong Trend Tracking Stop Loss Strategy
- Momentum Indicator Strategy
- Heikin-Ashi Reverse Strategy
- Dynamic Oscillation Breakout Strategy