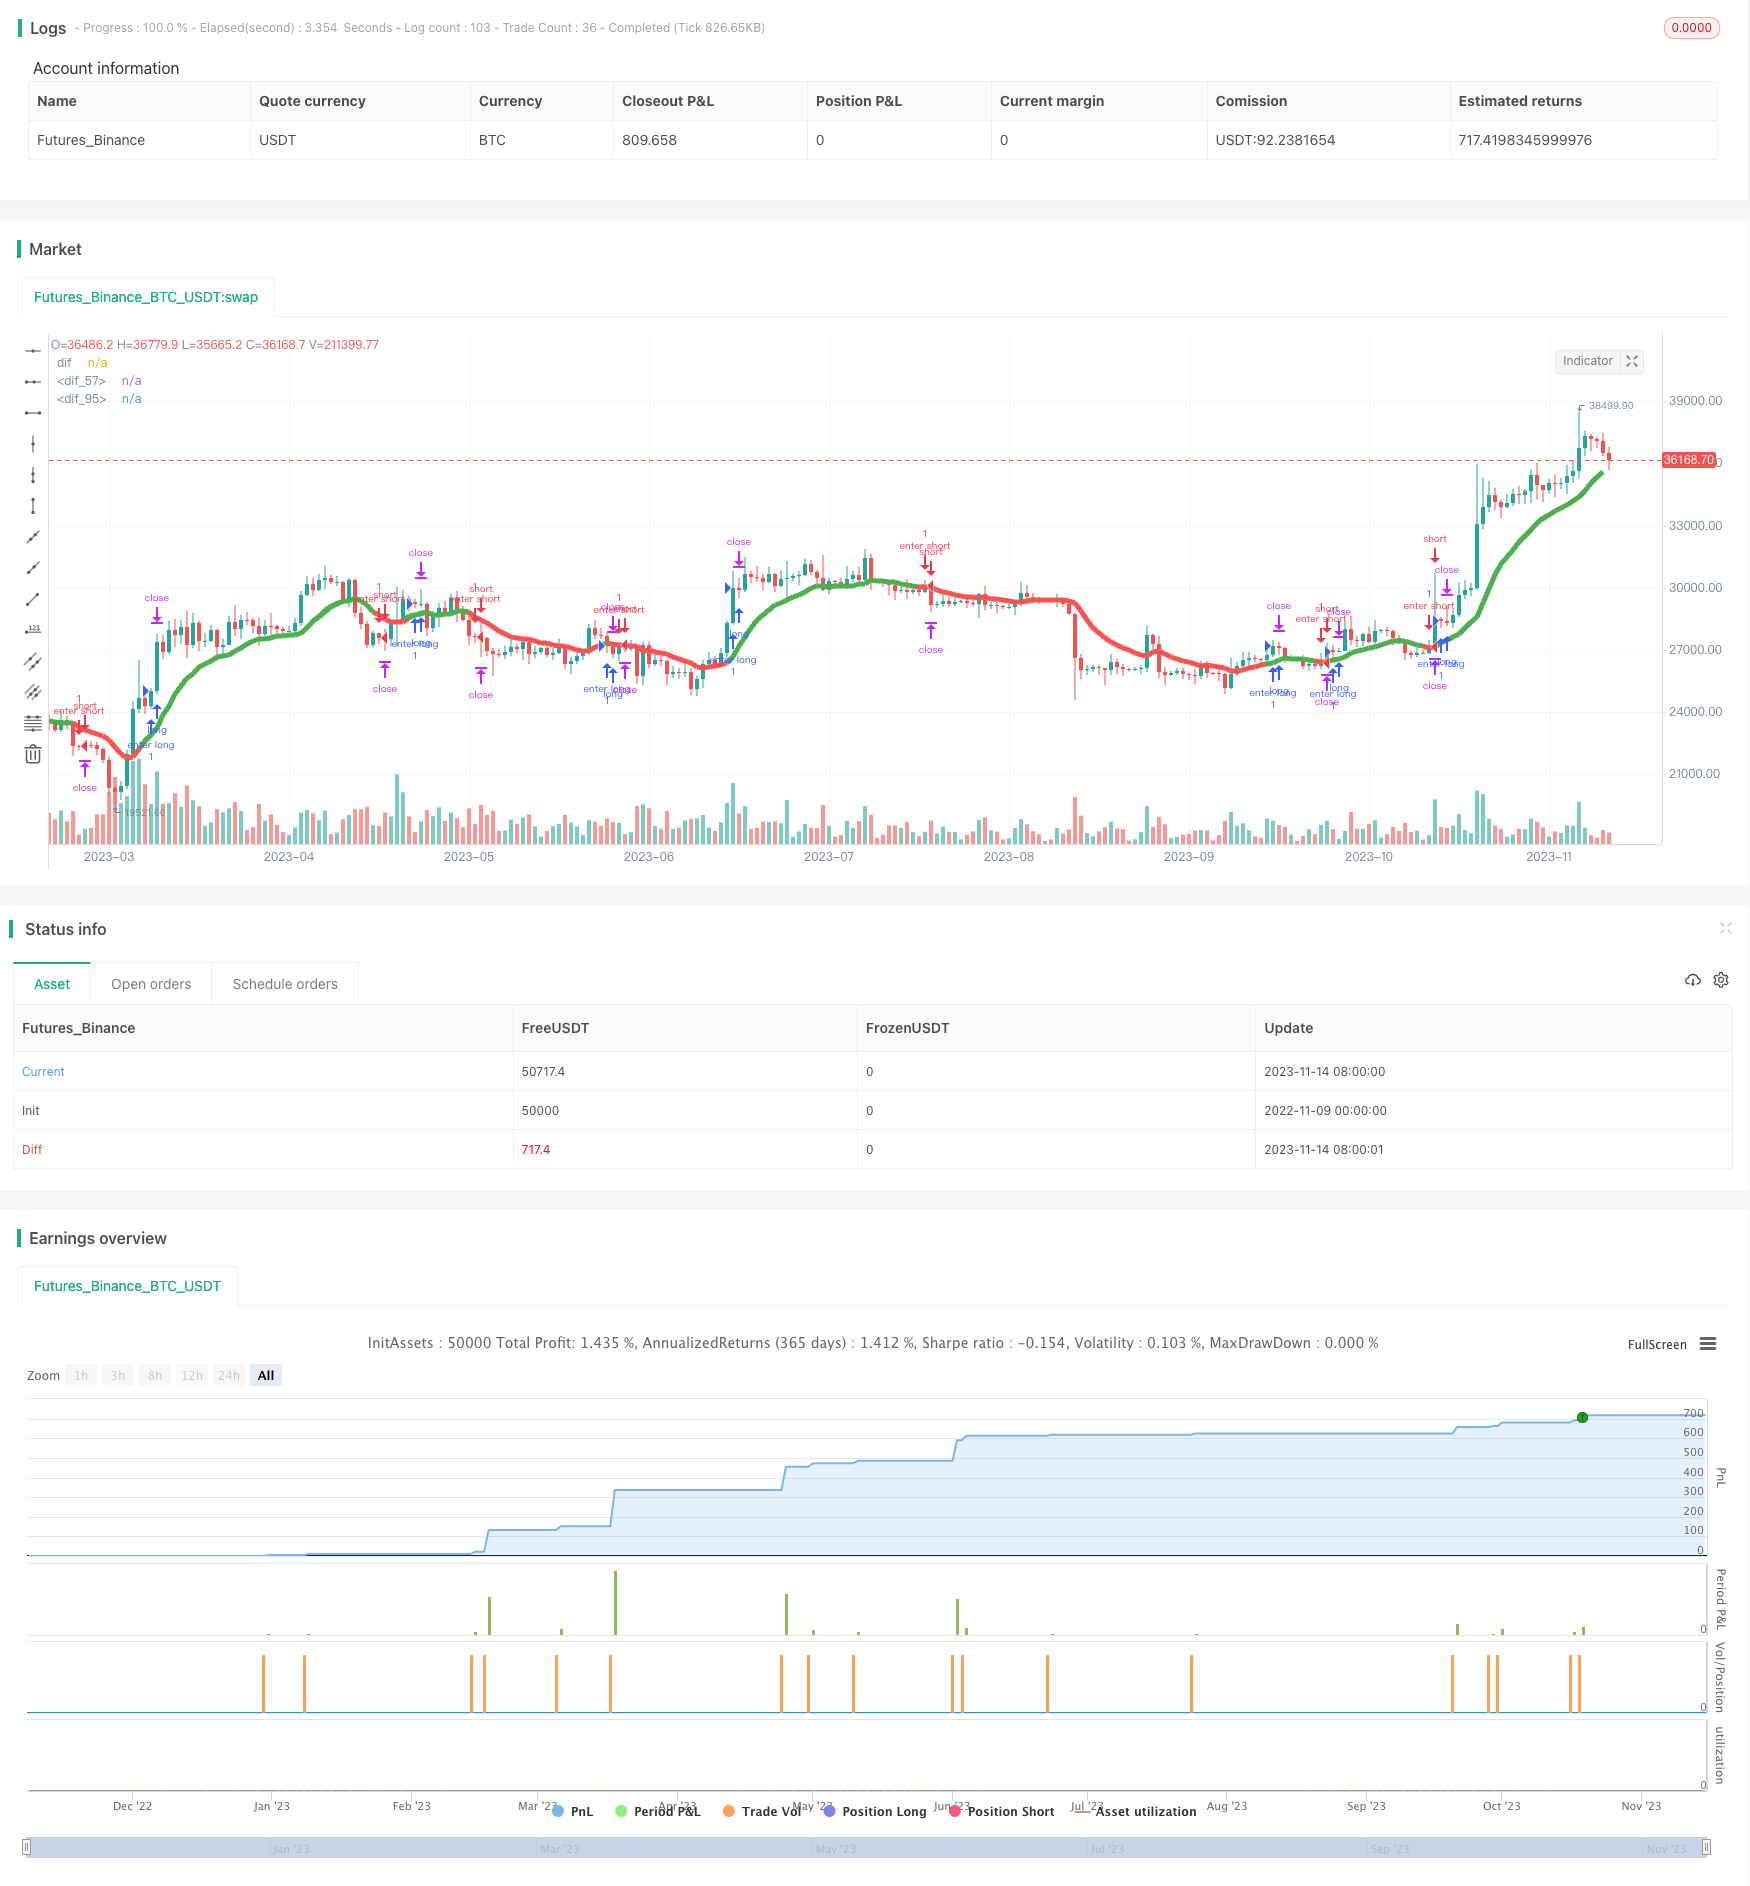
Multi-Timeframe Trend Tracking Intraday Scalping Strategy
Author: ChaoZhang, Date: 2023-11-16 17:47:06Tags:

Overview
This strategy combines moving average indicators across multiple timeframes to determine trend consistency and takes scalping actions during the day to follow the trend and make profits.
Strategy Logic
This strategy uses 8-period and 20-period moving averages on the 5-minute, 15-minute, 30-minute and 60-minute timeframes to generate trading signals. A buy signal is generated when the 8-period MA crosses above the 20-period MA. A sell signal is generated when the 8-period MA crosses below the 20-period MA.
The strategy requires consistent signals across the four timeframes before issuing a trade order. A buy or sell order is placed only when the moving averages align on all four timeframes.
Once entered into a position, the strategy sets a fixed profit target to take profits intraday.
Specifically, the strategy uses the security() function to retrieve MA values from different timeframes. It calculates the difference between the 8-period and 20-period MAs on the 5-min, 15-min, 30-min and 60-min charts.
Buy and sell signals are determined by whether the difference line crosses above/below the zero line. Multiple islong and isshort flags are used to record the signal on each timeframe. Orders are placed when the islong and isshort conditions are met.
After entering a trade, the strategy uses strategy.exit() to set a fixed profit target for scalping.
Advantage Analysis
The advantages of this strategy include:
-
Multi-timeframe design filters noise and reduces trade frequency.
-
Intraday scalping with profit optimization accumulates small gains consistently.
-
Clear code structure, easy to understand and optimize.
-
Reasonable conditions help control risk.
Risk Analysis
Potential risks of this strategy:
-
Multi-timeframe may miss subtle trend changes.
-
Frequent scalping trades increase costs.
-
Fixed profit target lacks flexibility.
-
Depends on indicators, risks being fooled.
Optimization Directions
Possible optimizations:
-
Add more timeframes for more robust signals.
-
Dynamic profit target based on ATR.
-
Additional filters like volume increase or history extremes.
-
Optimize MA periods for best parameters.
-
Add machine learning to judge signal reliability.
Summary
Overall this is a typical multi-timeframe trend tracking strategy using intraday scalping. The logic is clear and code well structured. With proper optimization it can become a very practical scalping strategy template.
/*backtest
start: 2022-11-09 00:00:00
end: 2023-11-15 00:00:00
period: 1d
basePeriod: 1h
exchanges: [{"eid":"Futures_Binance","currency":"BTC_USDT"}]
*/

//@version=2
strategy(title="PeBAS $JPY Scalper 15m ",overlay=true)
zeigeallebars= input(false, title="Zeige alle (Show all) Candles/Bars?")
profitwert=input(52, title="Profit")
myatr=  input(title="ATR", type=float, defval=0.00002, minval=0.00001,step=0.00001)


//Plot  EMA-Differenz Aktueller Timeframe

dif=(ema(close,8)+ema(close,20))/2
mcolor=ema(close,8) > ema(close,20) ? green : red
bs = ema(close,8) > ema(close,20) ? true : false
ThisATR=atr(16)

//trans = zeigeallebars == true ? 00 : 100
//plot(dif,"dif",color=mcolor,linewidth=6,transp=trans)


//1M EMA
htf_ma1Mema8 = ema(close, 5)
htf_ma1Mema20 = ema(close, 20)
ema81m=request.security(syminfo.tickerid, "1", htf_ma1Mema8)
ema201m=request.security(syminfo.tickerid, "1", htf_ma1Mema20)
dif1M = (ema81m + ema201m) / 2
Close1M = request.security(syminfo.tickerid, "1", close)
color1=ema81m > ema201m ? green : red
//plot(dif1M,"dif",color1,linewidth=6)
//plotshape(1, style=shape.cross, color=color1,location=location.top)
ls1 = ema81m > ema201m ? 1 : 0


//5M EMA

htf_ma5Mema8 = ema(close, 8)
htf_ma5Mema20 = ema(close, 20)
ema85m=request.security(syminfo.tickerid, "5", htf_ma5Mema8)
ema205m=request.security(syminfo.tickerid, "5", htf_ma5Mema20)
dif5M = (ema85m + ema205m) / 2

color5=ema85m > ema205m ? green : red
plot(dif5M,"dif",color5,linewidth=5)
ls5 = ema85m > ema205m ? 1 : 0
alert1= ema85m > ema205m and ema85m[1] < ema205m[1] ? 1 : 0
islong5 = ema85m > ema205m ? 1 : 0
isshort5 = ema85m < ema205m ? 1 : 0

//15M EMA

htf_ma15Mema8 = ema(close, 8)
htf_ma15Mema20 = ema(close, 20)
ema815m=request.security(syminfo.tickerid, "15", htf_ma15Mema8)
ema2015m=request.security(syminfo.tickerid, "15", htf_ma15Mema20)
dif15M = (ema815m + ema2015m) / 2

color15=ema815m > ema2015m ? green : red
plot(dif15M,"dif",color15,linewidth=3)
ls15= ema815m > ema2015m ? 1 : 0
alert2= ema815m > ema2015m and ema815m[1] < ema2015m[1] ? 1 : 0
islong15 = ema815m > ema2015m ? 1 : 0
isshort15 = ema815m < ema2015m ? 1 : 0


//30M EMA
htf_ma30Mema8 = ema(close, 8)
htf_ma30Mema20 = ema(close, 20)
ema830m=request.security(syminfo.tickerid, "30", htf_ma30Mema8)
ema2030m=request.security(syminfo.tickerid, "30", htf_ma30Mema20)
dif30M = (ema830m + ema2030m) / 2

color30=ema830m > ema2030m ? green : red
ls30= ema830m > ema2030m ?1 : 0
islong30 = ema830m > ema2030m ? 1 : 0
isshort30 = ema830m < ema2030m ? 1 : 0


//60M EMA

htf_ma60Mema8 = ema(close, 8)
htf_ma60Mema20 = ema(close, 20)
ema860m=request.security(syminfo.tickerid, "60", htf_ma60Mema8)
ema2060m=request.security(syminfo.tickerid, "60", htf_ma60Mema20)
dif60M = (ema860m + ema2060m) / 2

color60=ema860m > ema2060m ? green : red
ls60= ema860m > ema2060m ?1 : 0

islong60 = ema860m > ema2060m ? 1 : 0
isshort60 = ema860m < ema2060m ? 1 : 0

plot(dif60M,"dif",color60,linewidth=3,transp=70)

islong = islong5 ==1 and islong15 ==1 and islong60 ==1 and year > 2017 ? 1 : 0
isshort = isshort5 ==1 and isshort15 ==1 and  isshort60 ==1 and year > 2017 ? 1 : 0


condition2l= 0
condition2s = 0

c= alert1 == alert2  and alert1[1] != alert2[1] ? 1 : 0
alertcondition(c, title='Da tat sich was ', message='Da tat sich was!')

strategy.entry("enter long", strategy.long,1,when = islong ==1 and islong[1] == 0  )
strategy.entry("enter short", strategy.short,1,when = isshort == 1  and isshort [1] == 0)
strategy.exit("close",profit=profitwert)
strategy.exit("close",profit=profitwert)
- Momentum Rotation Across Timeframes Trend Following Strategy
- Multiple Trend Tracking Strategy
- Adaptive Moving Average Quantitative Strategy
- Cycle Position Trend Following Strategy
- Momentum Double Moving Average Strategy
- Dual Moving Average Reversion Strategy
- Bilinear Regression Trend Following Strategy
- Bidirectional Breakout Reversal Strategy
- Momentum Exhaustion Strategy
- Dual Moving Average Crossover Strategy
- MACD Trend Following Strategy
- Dual-track Bollinger Band Momentum Trading Strategy
- Ichimoku Kinko Hyo Trading Strategy
- MZ MA Cross Multiple TimeFrame Strategy
- Dual Moving Average Crossover Momentum Strategy
- Dual Moving Average Tracking Stop Loss Strategy
- Candlestick Body Based Dual Thrust Strategy
- Fixed Grid Trading Strategy
- Relative Strength Index Long/Short Strategy
- Dual Momentum Breakout Strategy