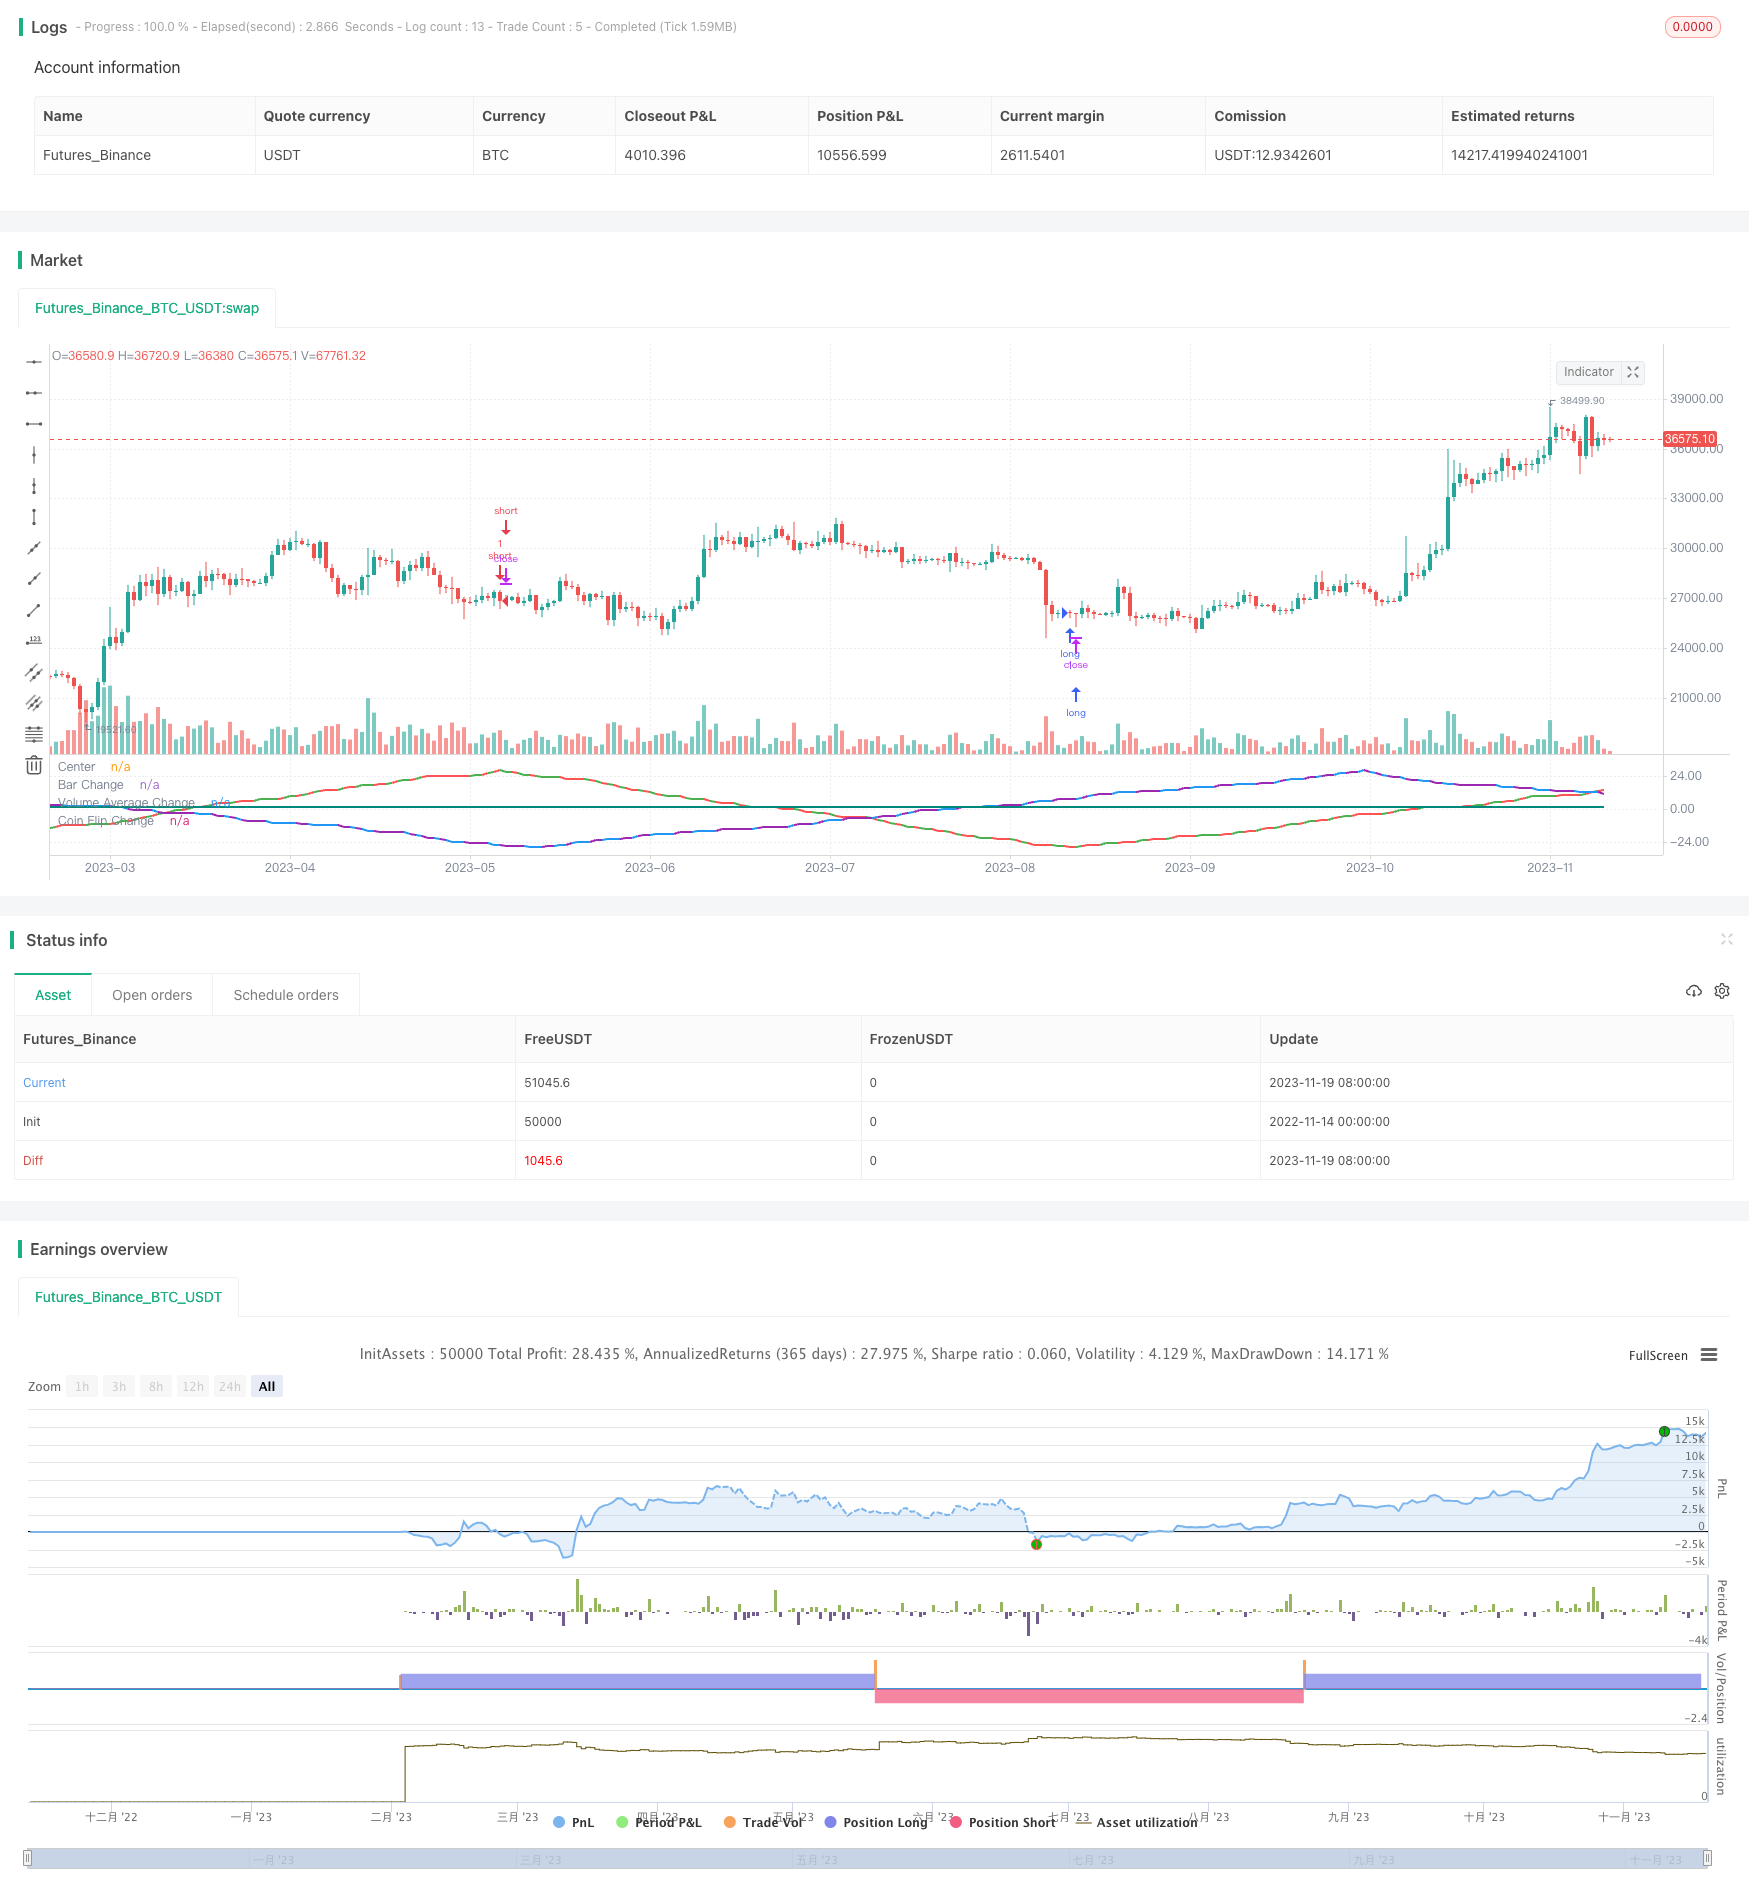
Overview
The purpose of this strategy is to test whether different input variables such as candlestick colors, volume and random methods can be used to predict price changes in the form of sine waves. The strategy converts these variables into sine wave forms. When the peaks or troughs reach the set number of times, buy or sell decisions are made.
Strategy Principle
The strategy is divided into three parts. The first part detects changes in candlestick colors. When a candle with a different color appears after several candles of the same color, the sine wave turns direction. The second part detects whether the volume is higher or lower than the average. When the average is broken, the wave turns direction. The third part uses a random method to simulate coin flipping. When the random result is different, the wave turns direction. When these three waves accumulate to the set number of times, trading decisions are made.
The code controls the running of the waves by tracking the current direction, number of peaks, and situation of the previous candlestick for the three waves. When the number of peaks reaches the parameter setting, it changes the running direction. This loop simulates the running of sine waves.
Advantage Analysis
This sine wave theory seems to make sense, and the simulated waveforms also have some correlation with the real market. But through the test of this strategy, it can be found that they are actually random results. Which combination of variables makes the waveform look more similar does not improve trading results.
So one advantage of this strategy is to refute the misconception that “the market can be predicted”. Variables in the market do affect prices, but they are unpredictable, and random decisions can also obtain similar results.
Risk Analysis
The biggest risk of this strategy is that it is difficult to determine profit and loss in random trading. The results under different parameters are also difficult to predict, and it is impossible to determine in advance whether it can be profitable.
In addition, the sine wave prediction theory itself is wrong. Market changes are too complex to simulate with simple cyclicity. So this strategy cannot really be used for actual trading.
To reduce risks, it is necessary to further analyze the random results to determine the parameter range; or combine other analytical methods to verify trading signals.
Optimization Directions
This strategy can be optimized in the following directions:
- Increase more variables converted into waves to expand the sample space
- Combine the three current waves to find the best traversal combination
- Set stop loss methods, such as percentage loss stops
- Optimize entry and exit logic and backtest to find optimal parameters
Summary
Through testing different sine waves, this strategy illustrates the unpredictable nature of the market. At the same time, it also refutes the erroneous theory of using wave cycles to predict.
Next, the practicality of the strategy can be improved by increasing variables, combining waveforms, setting stops, and optimizing parameters. But the key is still to understand that market changes are complex and unpredictable. What we need to do is reduce random risks rather than predict the market.
/*backtest
start: 2022-11-14 00:00:00
end: 2023-11-20 00:00:00
period: 1d
basePeriod: 1h
exchanges: [{"eid":"Futures_Binance","currency":"BTC_USDT"}]
*/

// This source code is subject to the terms of the Mozilla Public License 2.0 at https://mozilla.org/MPL/2.0/
// © Gentleman-Goat

//@version=5
strategy("Sine Wave Theory",overlay=false, precision = 2, initial_capital = 1000,shorttitle = "SINE_W_T")

var bar_change_wave_direction = input.int(defval=1,title="Starting Wave Direction",group="Bar Change")
bar_change_sine_wave_number = input.int(defval=28,title="Sine Wave #",group="Bar Change")
bar_change_sine_wave_res = input.timeframe(defval="D",title="Resolution",group="Bar Change")
bar_change_trade = input.bool(defval=true,title="Trade",group="Bar Change")

var volume_wave_direction = input.int(defval=1,title="Starting Wave Direction",group="Volume")
avg_volume_length = input.int(7,title="Lookback Length",group="Volume")
volume_sine_wave_number = input.int(defval=28,title="Sine Wave #",group="Volume")
volume_sine_wave_res = input.timeframe(defval="D",title="Resolution",group="Volume")
volume_trade = input.bool(defval=false,title="Trade",group="Volume")

var coin_flip_wave_direction = input.int(defval=1,title="Starting Wave Direction",group="Coin Flip")
coin_flip_sine_wave_number = input.int(defval=28,title="Sine Wave #",group="Coin Flip")
coin_flip_seed = input.int(defval=1,title="Seed #",group="Coin Flip")
coin_flip_trade = input.bool(defval=false,title="Trade",group="Coin Flip")

avg_volume = ta.sma(volume,avg_volume_length)

//Green or Red Candle
bar_color = close>open ? color.green : color.red
bar_color_time_adj = request.security(syminfo.tickerid, bar_change_sine_wave_res, bar_color)

//Above or Below Average
volume_state = (volume>avg_volume) ? color.blue : color.purple
volume_state_time_adj = request.security(syminfo.tickerid, volume_sine_wave_res, volume_state)

//Coinflip
coin_flip = math.random(0,100,coin_flip_seed)>=50 ? color.teal : color.yellow

var bar_change_wave_count = 0
var volume_wave_count = 0
var coin_flip_wave_count = 0

//Wave Counters
if(volume_state_time_adj[1] != volume_state_time_adj)
    volume_wave_count := volume_wave_count + volume_wave_direction

if(bar_color_time_adj[1] != bar_color_time_adj)
    bar_change_wave_count := bar_change_wave_count + bar_change_wave_direction

if(coin_flip[1] != coin_flip)
    coin_flip_wave_count := coin_flip_wave_count + coin_flip_wave_direction

//Direction changers
if(math.abs(bar_change_wave_count) == bar_change_sine_wave_number and bar_color_time_adj[1] != bar_color_time_adj)
    bar_change_wave_direction := bar_change_wave_direction * -1

if(math.abs(volume_wave_count) == volume_sine_wave_number and volume_state_time_adj[1] != volume_state_time_adj)
    volume_wave_direction := volume_wave_direction * -1

if(math.abs(coin_flip_wave_count) == coin_flip_sine_wave_number and coin_flip[1] != coin_flip)
    coin_flip_wave_direction := coin_flip_wave_direction * -1

//Entry positions
if(bar_change_wave_count==bar_change_sine_wave_number and bar_change_trade==true)
    strategy.entry(id="short",direction=strategy.short)
if(bar_change_wave_count==bar_change_sine_wave_number*-1 and bar_change_trade==true)
    strategy.entry(id="long",direction=strategy.long)

if(volume_wave_count==volume_sine_wave_number and volume_trade==true)
    strategy.entry(id="short-volume",direction=strategy.short)
if(volume_wave_count==volume_sine_wave_number*-1 and volume_trade==true)
    strategy.entry(id="long-volume",direction=strategy.long)

if(coin_flip_wave_count==coin_flip_sine_wave_number and coin_flip_trade==true)
    strategy.entry(id="short-coinflip",direction=strategy.short)
if(coin_flip_wave_count==coin_flip_sine_wave_number*-1 and coin_flip_trade==true)
    strategy.entry(id="long-coinflip",direction=strategy.long)

hline(0, title='Center', color=color.white, linestyle=hline.style_dashed, linewidth=1)
plot(bar_change_wave_count,title="Bar Change", color=bar_color, linewidth=2)
plot(volume_wave_count,title="Volume Average Change", color=volume_state, linewidth=2)
plot(coin_flip_wave_count,title="Coin Flip Change", color=coin_flip, linewidth=2)