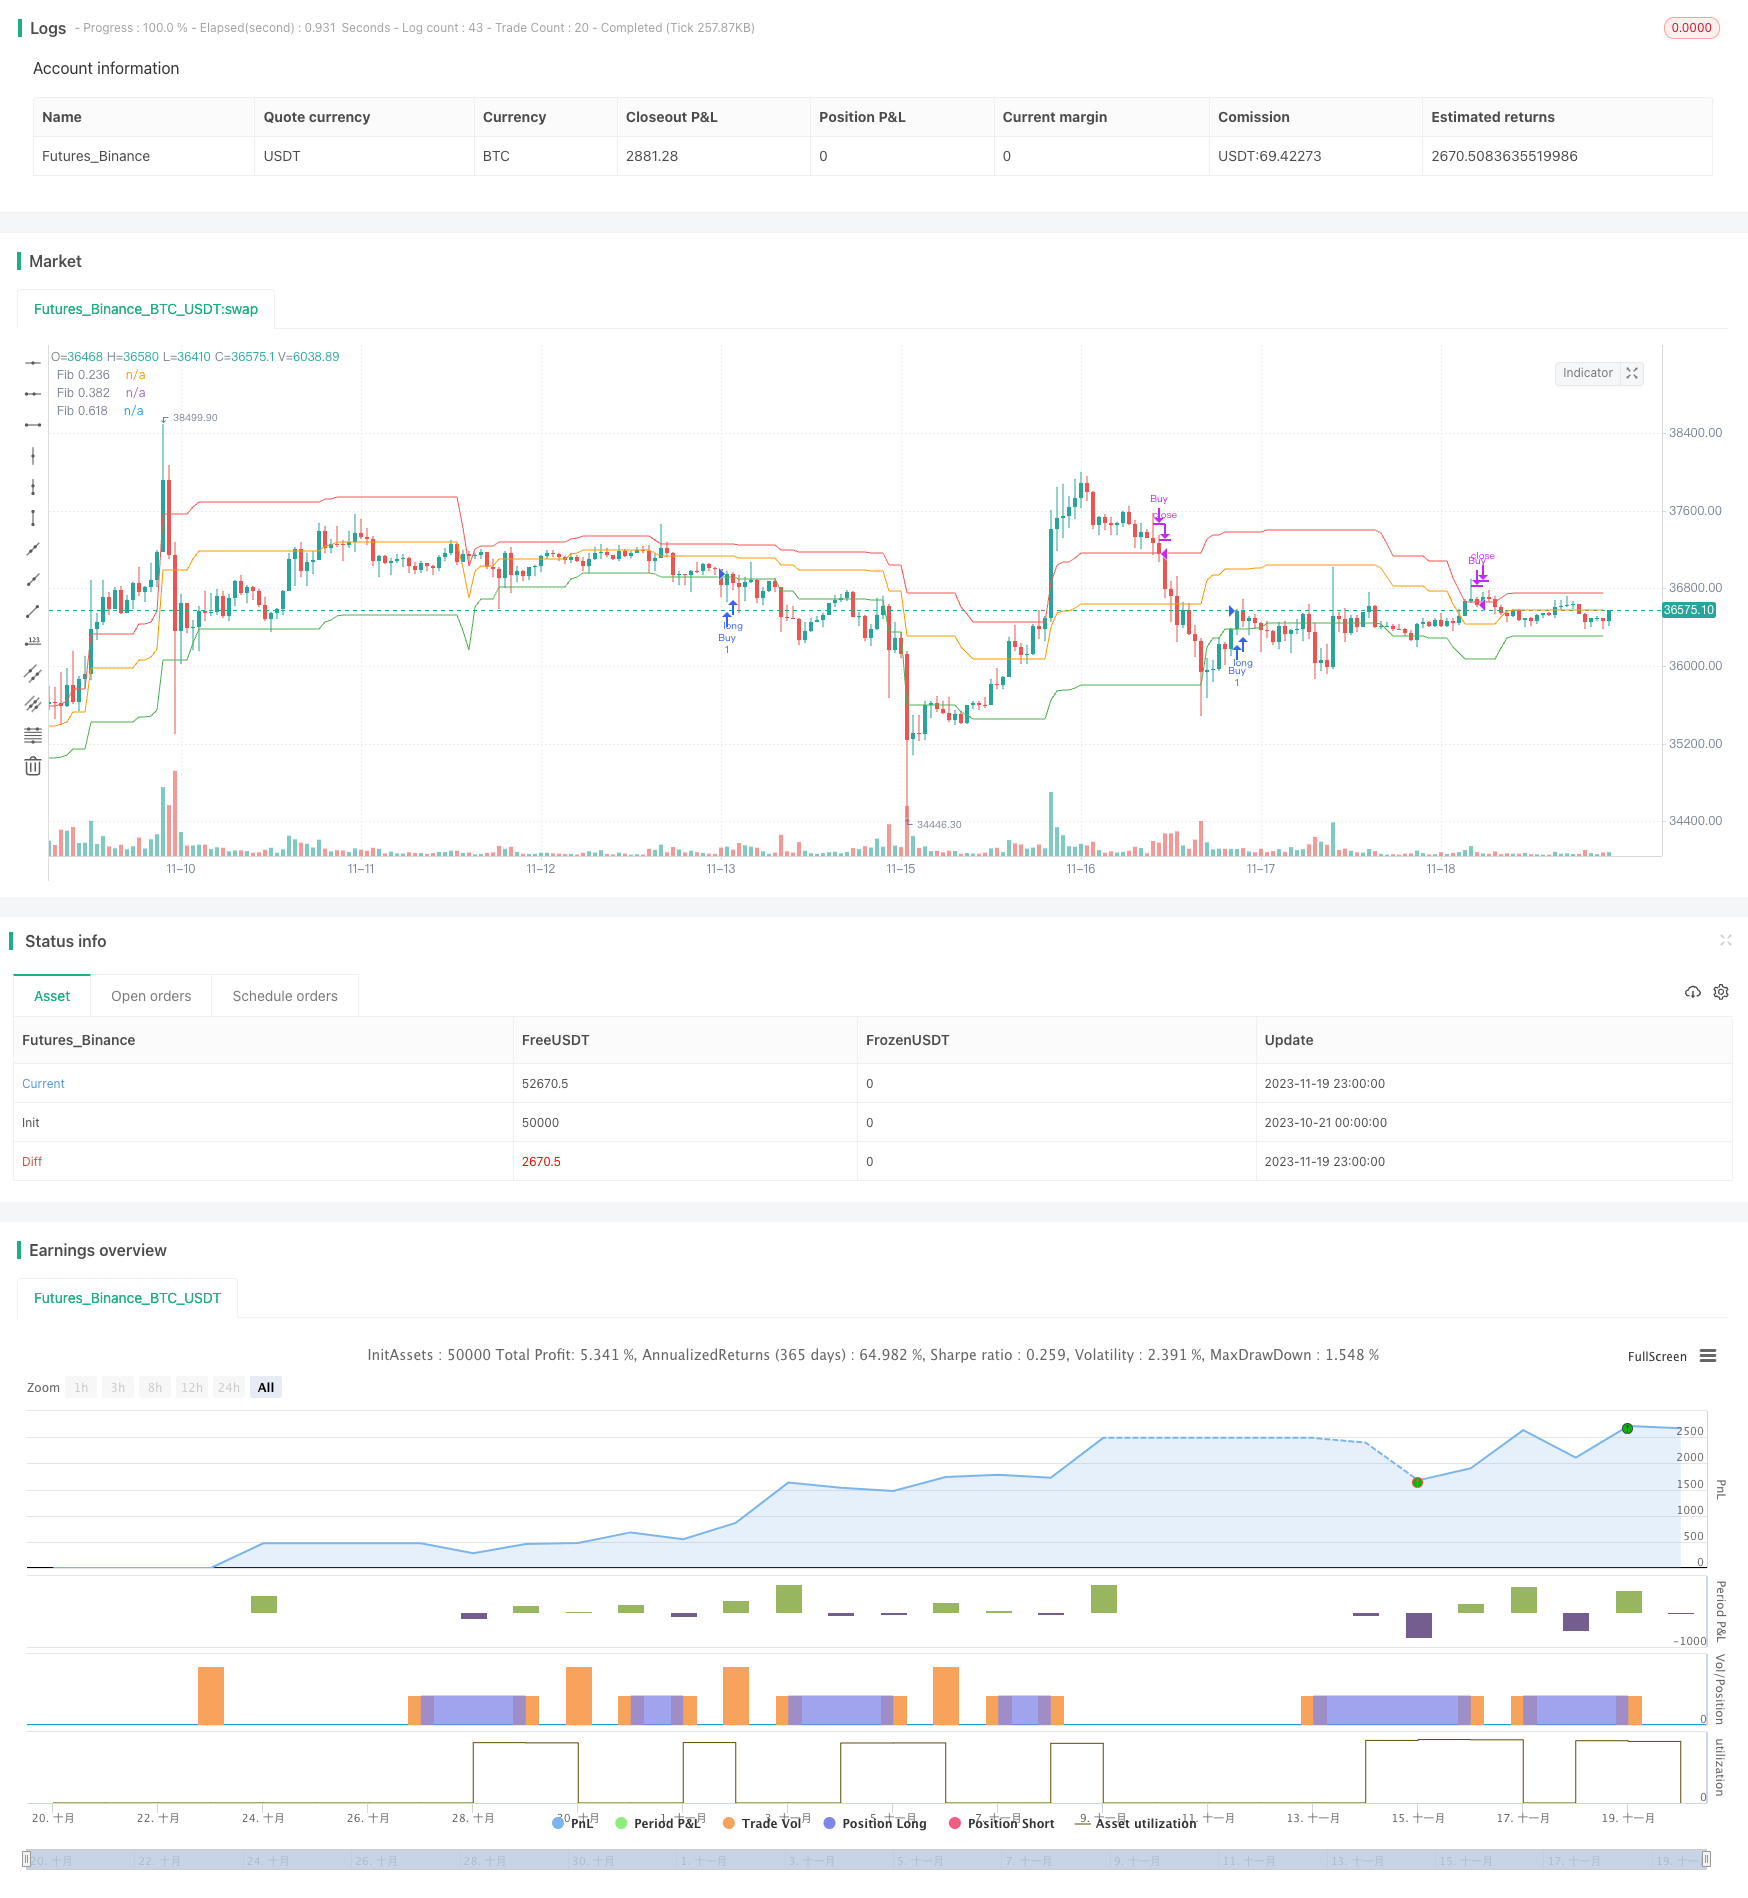
Overview
This strategy is designed based on the Fibonacci retracement principle. It enters long or short positions when prices rise or fall and approach key Fibonacci retracement levels. The strategy utilizes Fibonacci theory to identify critical reversal points in prices and appropriately enters positions ahead of trend reversals, aiming for excess returns over the broader market.
Principles
The strategy first calculates the highest and lowest prices over the past 50 days to determine price movement range. It then uses three key Fibonacci ratios - 0.236, 0.382 and 0.618 to calculate corresponding retracement levels. It goes long when prices rise and approach the 0.618 level (golden ratio), and closes long positions when prices fall to 0.236 level.
The strategy leverages the Fibonacci retracement theory, which observes that in a Fibonacci sequence, any number is approximately equal to the ratio of the preceding two numbers, and this ratio is close to 0.618. The theory suggests that prices tend to reverse when retracing to 0.382 or 0.618 levels after a rise or fall. This strategy hence utilizes this pattern to determine entry and exit signals.
Advantages
This is a typical breakout trading strategy. Its biggest edge is the ability to identify key reversal points beforehand and appropriately enter positions before trend reversals. Additionally, Fibonacci theory is widely applied in technical analysis, giving this strategy academic merits.
Risks
The main risk is prices continuing to trend after penetrating Fibonacci retracement levels, thus amplifying losses. Moreover, empirical trading strategies cannot completely avoid losses due to misjudged signals.
To mitigate risks, stop losses can be set to exit positions if losses exceed certain threshold. Fibonacci levels can also be dynamically adjusted based on changing market conditions to generate more reliable signals.
Enhancement Areas
The strategy can be optimized in the following ways:
Dynamically adjust Fibonacci levels based on varying market stages, allowing for more flexibility.
Add other indicators for signal filtering, e.g. volume, moving averages etc, to make signals more reliable.
Optimize stop loss mechanisms with trailing stops, zone stops etc to better control risks.
Test over longer time frames to verify stability; adjust holding period to maximize returns.
Conclusion
This strategy identifies price reversal points based on Fibonacci theory, belonging to the breakout trading category. It has academic merits in seizing turning point opportunities ahead of the market, but also bears certain probability of losses. Continual optimizations around adaptive parameters, stop losses, extra signal filtering etc can enhance its profitability and stability.
/*backtest
start: 2023-10-21 00:00:00
end: 2023-11-20 00:00:00
period: 1h
basePeriod: 15m
exchanges: [{"eid":"Futures_Binance","currency":"BTC_USDT"}]
*/

//@version=5
strategy("斐波那契回撤交易策略", overlay=true, initial_capital=10000)

// 参数
length = input(50, title="斐波那契周期长度")
fib1 = input(0.236, title="斐波那契水平1")
fib2 = input(0.382, title="斐波那契水平2")
fib3 = input(0.618, title="斐波那契水平3")

// 计算斐波那契水平
highLevel = ta.highest(high, length)
lowLevel = ta.lowest(low, length)
range1 = highLevel - lowLevel
fibLevel1 = highLevel - range1 * fib1
fibLevel2 = highLevel - range1 * fib2
fibLevel3 = highLevel - range1 * fib3

// 条件
longCondition = ta.crossover(close, fibLevel3)
shortCondition = ta.crossunder(close, fibLevel1)

// 下单
strategy.entry("Buy", strategy.long, when=longCondition)
strategy.close("Buy", when=shortCondition)

// 图表标记
plot(fibLevel1, title="Fib 0.236", color=color.red)
plot(fibLevel2, title="Fib 0.382", color=color.orange)
plot(fibLevel3, title="Fib 0.618", color=color.green)