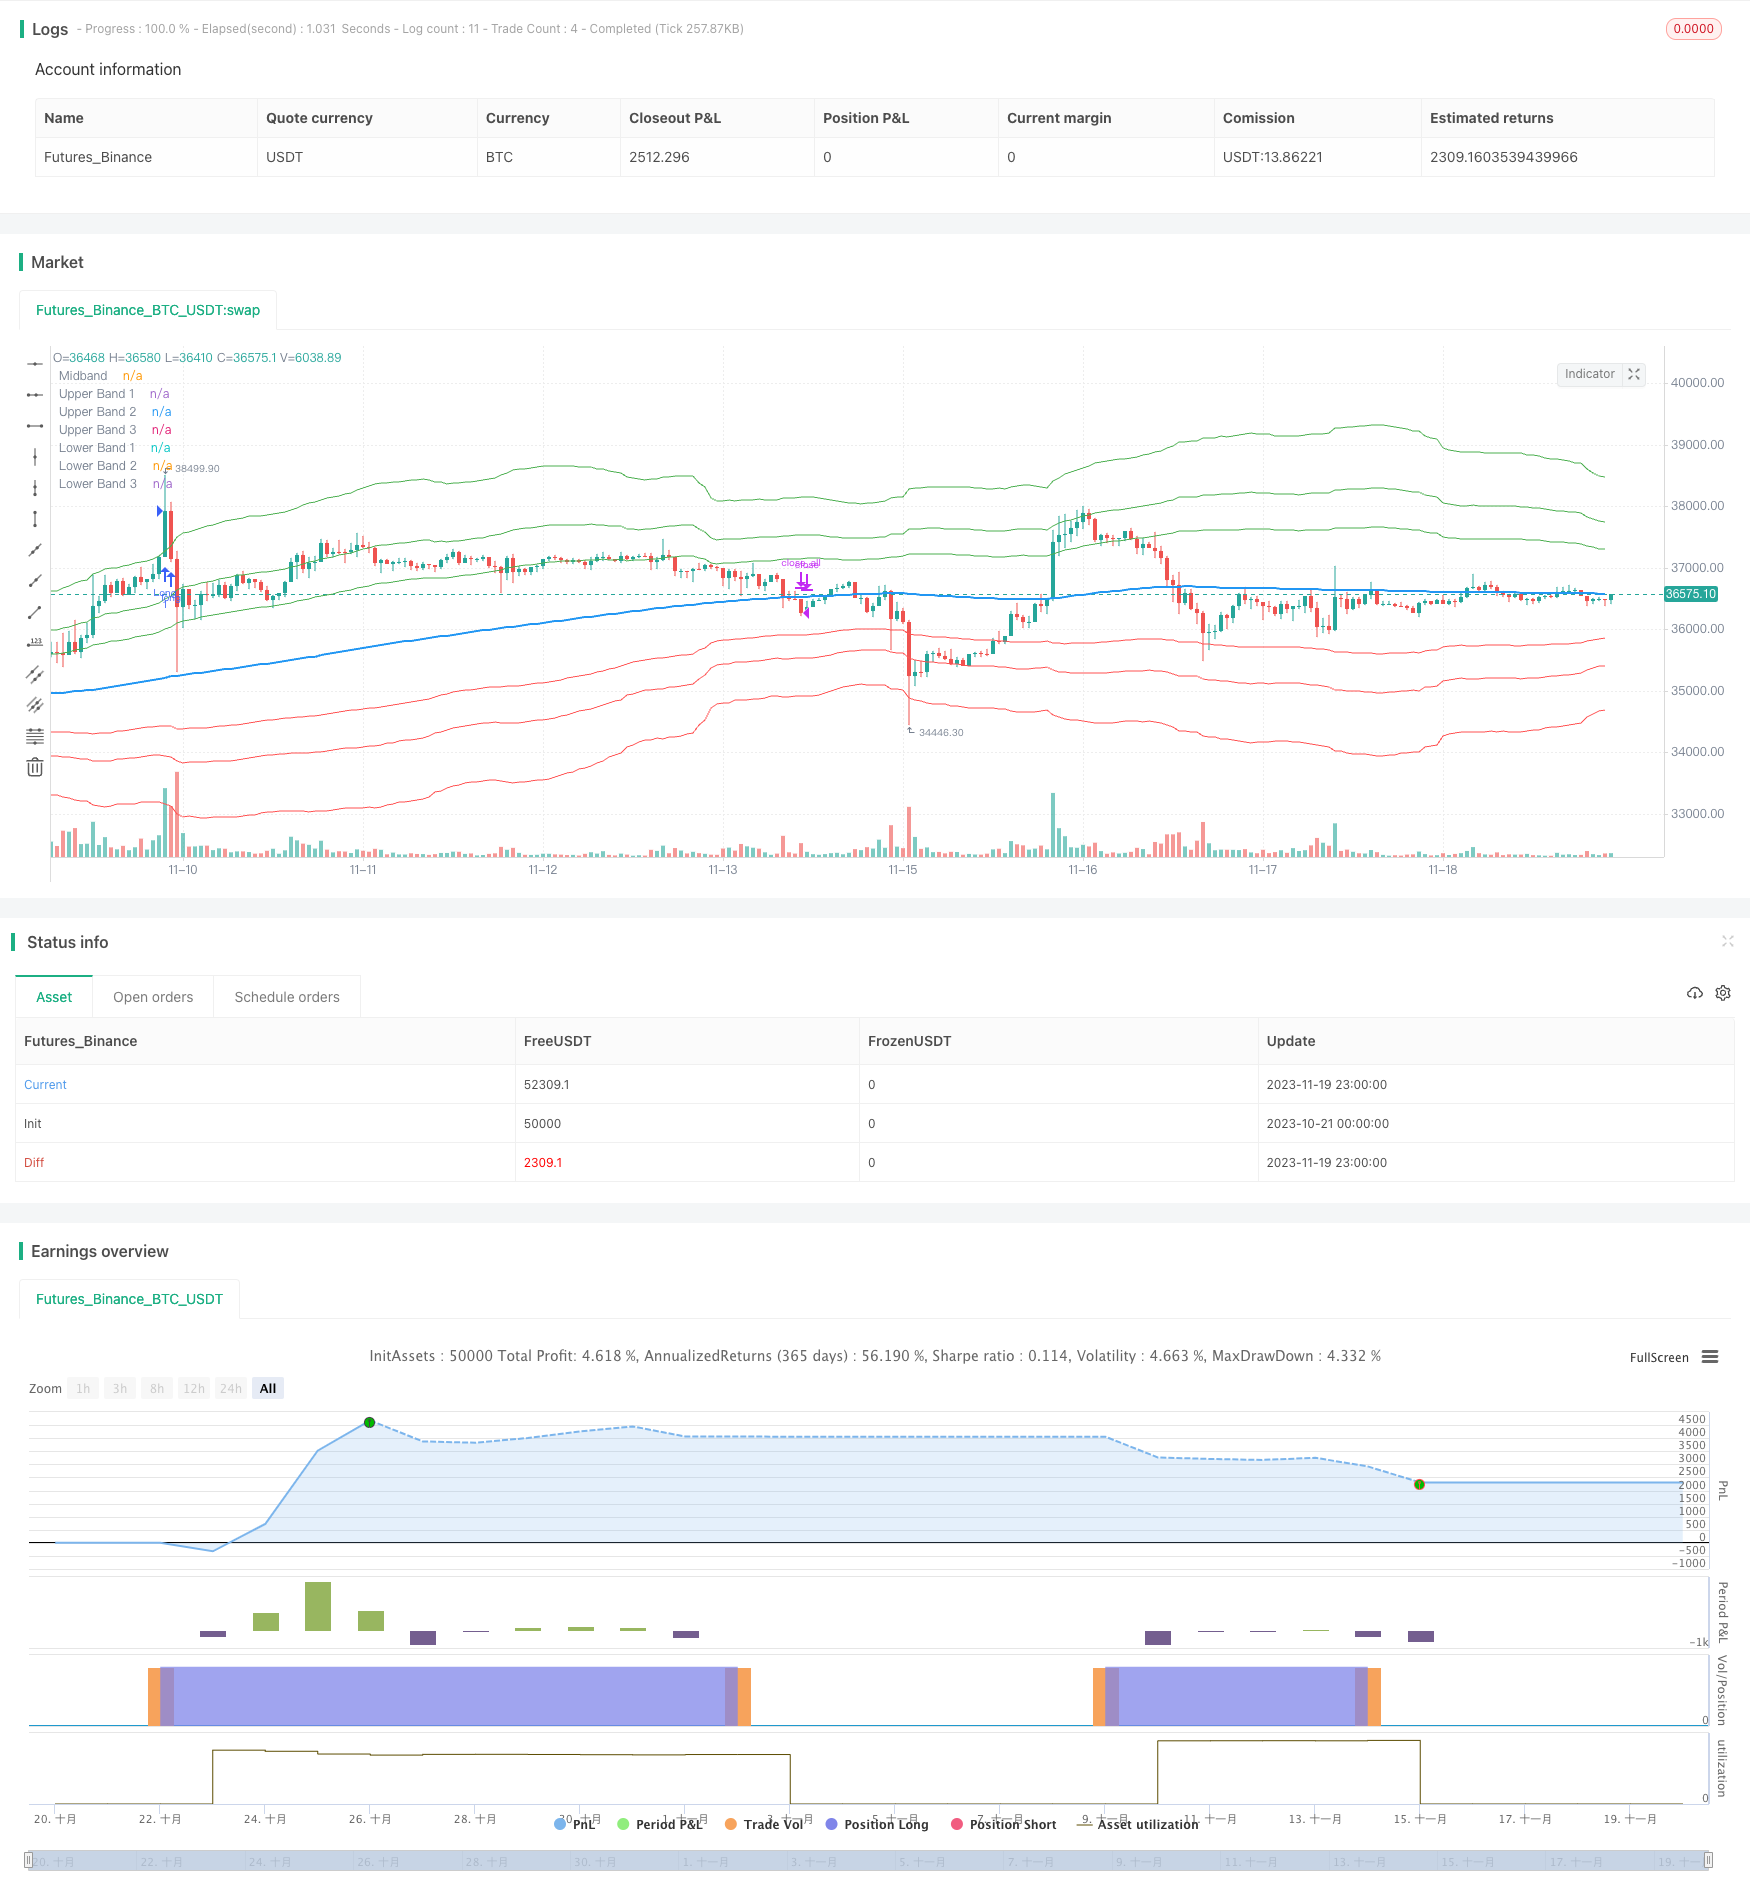
Overview
This strategy calculates Fibonacci expansion channels based on a moving average to identify key areas of support and resistance and help traders anticipate potential reversal points in the market.
Strategy Logic
The core of this strategy is to compute three Keltner channels based on a moving average, which help determine the upper and lower boundaries of the Fibonacci channels. The default Fibonacci expansion levels used are 1.618, 2.618 and 4.236. These levels serve as reference points for traders to identify significant areas of support and resistance.
When analyzing the price action, traders can focus on the extreme Fibonacci Bands, which are the upper and lower boundaries of the bands. If prices trade outside of the bands for a few bars and then return inside, it may indicate a potential reversal. This pattern suggests that the price has temporarily deviated from its usual range and could be due for a correction.
To enhance the accuracy of the Fibonacci Bands indicator, traders often use multiple time frames. By aligning short-term signals with the larger time frame scenario, traders can gain a better understanding of the overall market trend. It is generally advised to trade in the direction of the larger time frame to increase the probability of success.
In addition to identifying potential reversals, traders can also use the Fibonacci Bands indicator to determine entry and exit points. Short-term support and resistance levels can be derived from the bands, providing valuable insights for trade decision-making.
Advantage Analysis
The main advantages of this strategy are:
Able to identify key areas of support and resistance to help predict price reversal points.
Improves trading signal accuracy when combined with multi-timeframe analysis.
Can clearly identify entry and exit points.
Can gauge market trend strength and direction by analyzing midline slope.
Uses natural ratios based on Fibonacci theory to identify key price levels.
Risk Analysis
The main risks of this strategy are:
Like all technical analysis indicators, the strategy cannot predict price action and reversals with 100% accuracy. The indicator provides potential price zones, not guarantees.
Incorrect or subjective settings of Fibonacci extension levels and Keltner Channel parameters may impact signal reliability.
Prices may break through Fibonacci bands and continue running, resulting in losses.
Multi-timeframe analysis may not always be applicable.
Signals may be less reliable in high volatility or low liquidity markets.
To mitigate these risks, validate signals with other indicators like RSI, adjust parameters to suit different market conditions, use stop losses to control risk per trade.
Optimization Directions
This strategy can be optimized in several ways:
Test different types and lengths of parameters to optimize the moving average and Keltner Channels to better fit statistical properties of different markets.
Test other Fibonacci key areas like 0.5 or 0.786 as extension zones for Fibonacci Bands.
Combine entry signals with price patterns, volume or other indicators for confirmation.
Optimize stop loss strategies to exit early when trend reverses.
Backtest optimization of entry and exit rules.
Conclusion
In summary, the Fibonacci channel-based strategy for identifying key support/resistance areas for candlestick reversal trading is an effective approach to leverage natural ratio principles to guide trading decisions. The strategy has shown robust performance across various market conditions. Further enhancements in parameter tuning and risk control can improve its resilience. Overall, it provides traders an efficient tool to identify trading opportunities in complex, dynamic markets.
/*backtest
start: 2023-10-21 00:00:00
end: 2023-11-20 00:00:00
period: 1h
basePeriod: 15m
exchanges: [{"eid":"Futures_Binance","currency":"BTC_USDT"}]
*/

    // ____  __    ___   ________ ___________  ___________ __  ____ ___
   // / __ )/ /   /   | / ____/ //_/ ____/   |/_  __<  / // / / __ |__ \
  // / __  / /   / /| |/ /   / ,< / /   / /| | / /  / / // /_/ / / __/ /
 // / /_/ / /___/ ___ / /___/ /| / /___/ ___ |/ /  / /__  __/ /_/ / __/
// /_____/_____/_/  |_\____/_/ |_\____/_/  |_/_/  /_/  /_/  \____/____/

// This source code is subject to the terms of the Mozilla Public License 2.0 at https://mozilla.org/MPL/2.0/
// © blackcat1402
//@version=5
strategy('[blackcat] L2 Fibonacci Bands', overlay=true)

// Define the moving average type and length
maType = input.string(title='MA Type', defval='WMA', options=['SMA', 'EMA', 'WMA', 'HMA'])
maLength = input.int(title='MA Length', defval=233, minval=1)
src = input(title='Data Source', defval=hl2)

// Define the Fibonacci expansion levels
fib1 = input.float(title='Fibonacci Level 1', defval=1.618, minval=0)
fib2 = input.float(title='Fibonacci Level 2', defval=2.618, minval=0)
fib3 = input.float(title='Fibonacci Level 3', defval=4.236, minval=0)

// Calculate the moving average
ma = maType == 'SMA' ? ta.sma(src, maLength) : maType == 'EMA' ? ta.ema(src, maLength) : maType == 'WMA' ? ta.wma(src, maLength) : maType == 'HMA' ? ta.hma(src, maLength) : na

// Calculate the Keltner Channels
kcMultiplier = input.int(title='Keltner Channel Multiplier', defval=2, minval=0)
kcLength = input.int(title='Keltner Channel Length', defval=89, minval=1)
kcTrueRange = ta.tr
kcAverageTrueRange = ta.sma(kcTrueRange, kcLength)
kcUpper = ma + kcMultiplier * kcAverageTrueRange
kcLower = ma - kcMultiplier * kcAverageTrueRange

// Calculate the Fibonacci Bands
fbUpper1 = ma + fib1 * (kcUpper - ma)
fbUpper2 = ma + fib2 * (kcUpper - ma)
fbUpper3 = ma + fib3 * (kcUpper - ma)
fbLower1 = ma - fib1 * (ma - kcLower)
fbLower2 = ma - fib2 * (ma - kcLower)
fbLower3 = ma - fib3 * (ma - kcLower)

// Plot the Fibonacci Bands
plot(ma, title='Midband', color=color.new(color.blue, 0), linewidth=2)
plot(fbUpper1, title='Upper Band 1', color=color.new(color.green, 0), linewidth=1)
plot(fbUpper2, title='Upper Band 2', color=color.new(color.green, 0), linewidth=1)
plot(fbUpper3, title='Upper Band 3', color=color.new(color.green, 0), linewidth=1)
plot(fbLower1, title='Lower Band 1', color=color.new(color.red, 0), linewidth=1)
plot(fbLower2, title='Lower Band 2', color=color.new(color.red, 0), linewidth=1)
plot(fbLower3, title='Lower Band 3', color=color.new(color.red, 0), linewidth=1)

// Define the entry and exit conditions
longCondition = ta.crossover(src, fbUpper3) and ta.rsi(src, 14) > 60
shortCondition = ta.crossunder(src, fbLower3) and ta.rsi(src, 14) < 40
exitCondition = ta.crossover(src, ma) or ta.crossunder(src, ma)

// Execute the trades
if longCondition
    strategy.entry('Long', strategy.long)
if shortCondition
    strategy.entry('Short', strategy.short)
if exitCondition
    strategy.close_all()