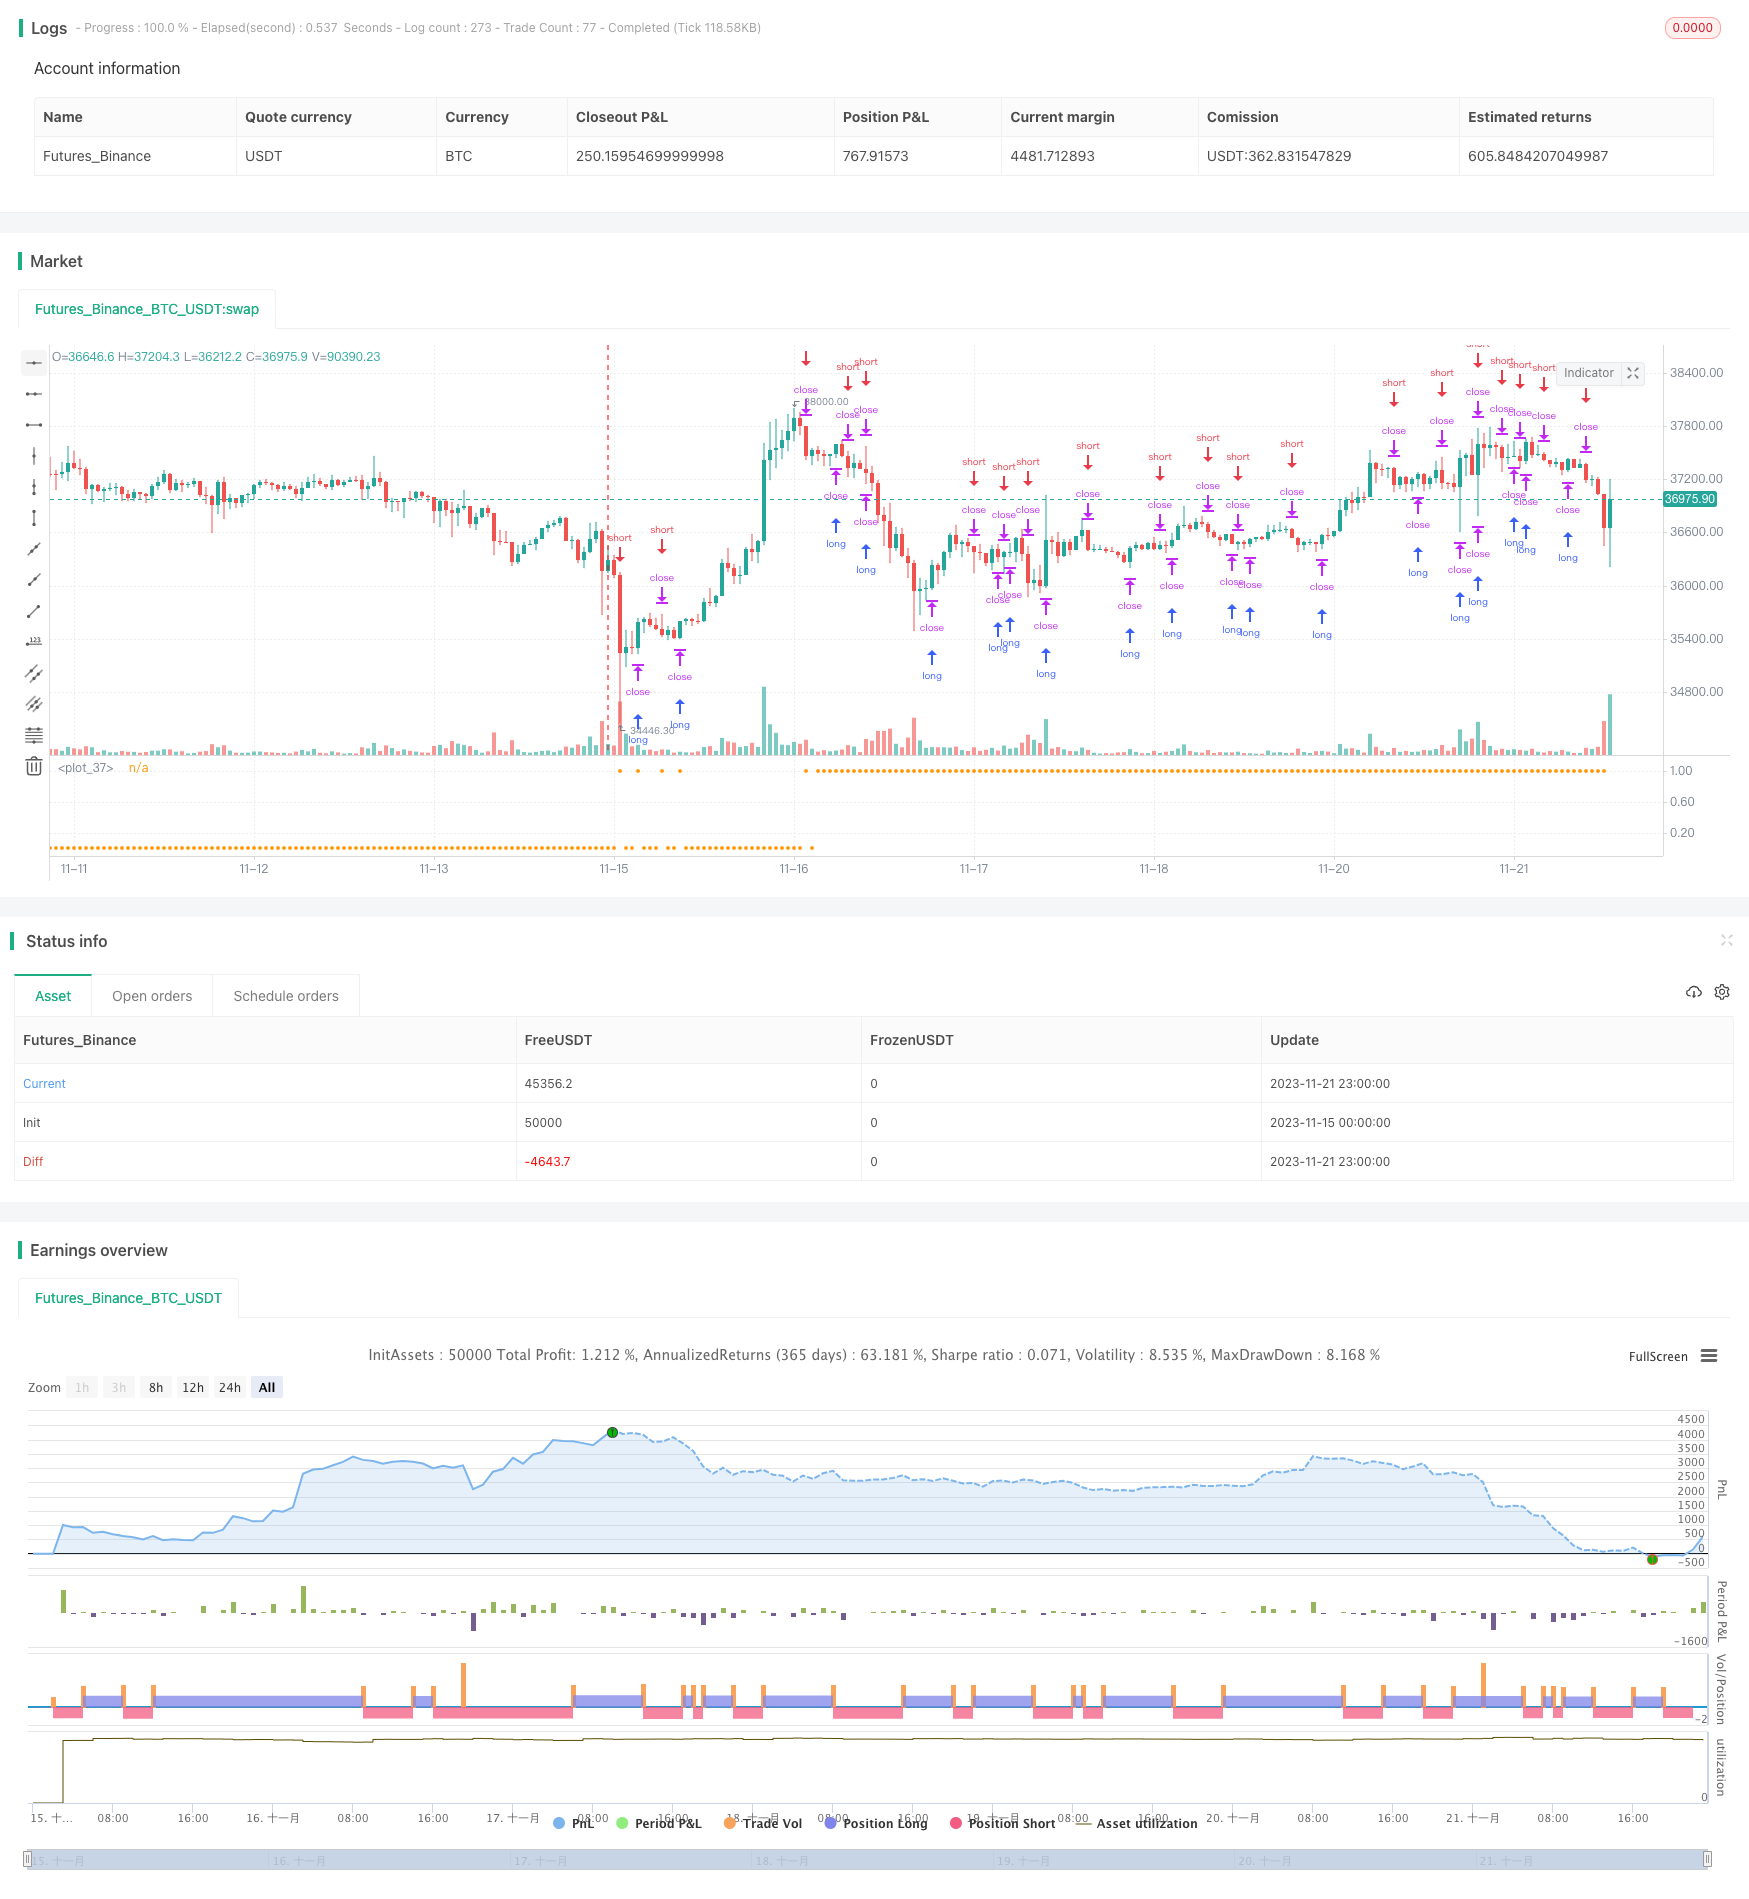
Overview
This strategy is a trend tracking strategy designed based on the channel breakout theory. It constructs a channel using highest price and lowest price over a certain period and generates trading signals when price breaks out of the channel. This strategy is suitable for trending markets and can capture the trend direction of the price for trend tracking.
Strategy Logic
The strategy first calculates the highest price and lowest price over a length period to construct the upper band and lower band of the channel. When the closing price breaks through the upper band, a long position is opened. When the closing price breaks through the lower band, a short position is opened. The position will be closed when price falls back into the channel.
The strategy also plots an EMA indicator with length *2 to determine the trend direction. When price breaks through the upper band, if EMA is in an upward trend, the long decision is strengthened.
Advantage Analysis
- The strategy can capture price trends and is suitable for trending markets with high profit potential.
- Using channel breakouts to generate signals can reduce false breakouts and improve signal quality.
- Combining with EMA to avoid trading against the trend and ensuring tracking the main trend.
Risk Analysis
- Breakout strategies tend to generate frequent trades during price consolidation, possibly incurring high trading costs.
- The strategy cannot exit positions promptly when trend reverses, which may lead to large losses.
- The strategy is sensitive to parameter settings and different parameters can lead to completely different results.
Optimization Directions
- Incorporate other indicators such as MACD, RSI to avoid false breakouts.
- Use machine learning algorithms to automatically optimize parameters and improve robustness.
- Set stop loss to control maximum drawdown.
Summary
In summary, this is a simple trend tracking strategy based on channel breakouts to capture trends. It has strong trend tracking capability and can achieve good returns in trending markets. But it also has some risks and needs further optimization to improve stability. Through parameter tuning, stop loss setting and combining with other indicators, this strategy can be applied to live trading.
/*backtest
start: 2023-11-15 00:00:00
end: 2023-11-22 00:00:00
period: 1h
basePeriod: 15m
exchanges: [{"eid":"Futures_Binance","currency":"BTC_USDT"}]
*/

//@version=3


initial_capital = 1000,
default_qty_value = 90,
default_qty_type = strategy.percent_of_equity,
pyramiding = 0,
commission_value = 0.002,
commission_type = strategy.commission.percent,
calc_on_every_tick = true
length_val = 2
max_bars_back = 1440
risk_max_drawdown = 9


strategy("Channel Break",max_bars_back=max_bars_back,initial_capital = initial_capital,default_qty_value = default_qty_value,default_qty_type = default_qty_type,pyramiding = pyramiding,commission_value = commission_value,commission_type = commission_type,calc_on_every_tick = calc_on_every_tick)
// strategy.risk.max_drawdown(risk_max_drawdown, strategy.percent_of_equity)

length = input(title="Length",  minval=1, maxval=1000, defval=length_val)

upBound = highest(high, length)
downBound = lowest(low, length)

//plot (upBound)
//plot (downBound)
//plot (close, color=red)
//plot (ema(close,length * 2), color=green)
//
if (not na(close[length]) and time>timestamp(2018, 02, 24, 0, 00) )
    strategy.entry("Buy", strategy.long, stop=upBound + syminfo.mintick, comment="Buy")
    strategy.entry("Short", strategy.short, stop=downBound - syminfo.mintick, comment="Short")

position = strategy.position_size


//plot(position , title="equity", color=red,style=cross,linewidth=4)
plot(variance(position,2)>0?1:0,style=circles,linewidth=4)

message = ""

if (position > 0)
    message = "BTCUSD L: " + tostring(strategy.position_size)
    na(position)

if (position < 0)
    message = "BTCUSD S: " + tostring(strategy.position_size)
    na(position)

alertcondition(variance(strategy.position_size,2) > 0, "test", message )