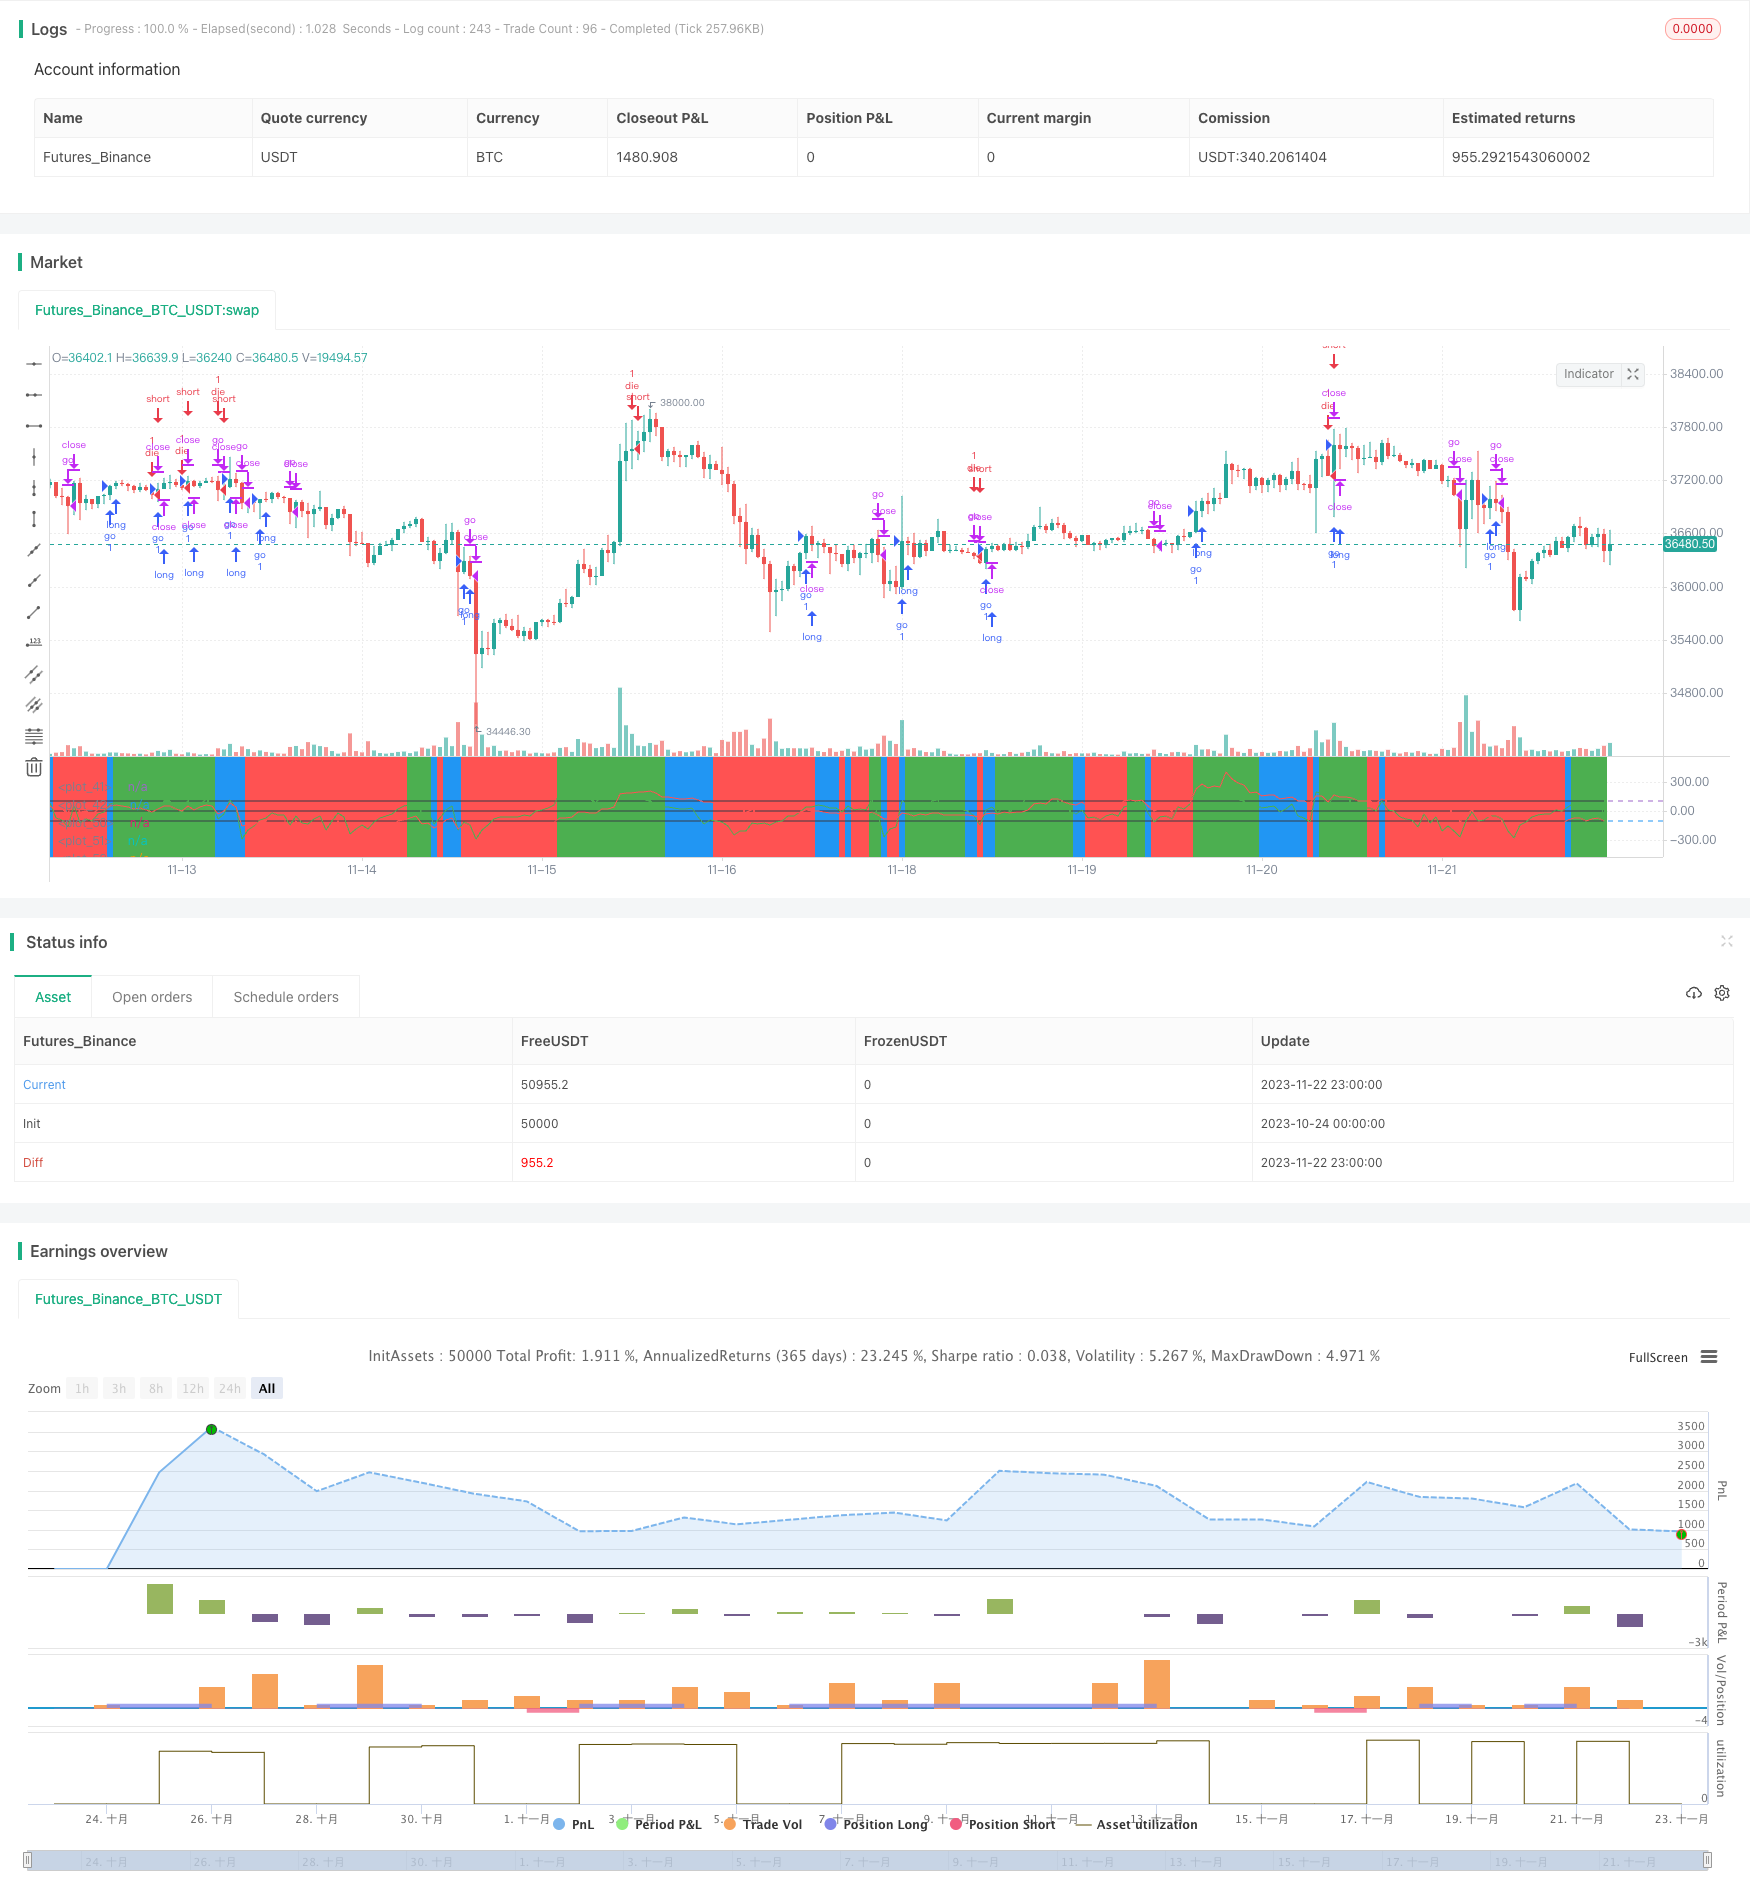
CCI Dual Timeframe Trend Following Strategy
Author: ChaoZhang, Date: 2023-11-24 10:53:07Tags:

Overview
This strategy is a trend following strategy based on the CCI indicator. It generates trading signals by monitoring the crossover between two CCIs of different timeframes. Specifically, it will detect if a shorter period CCI breaks through a longer period CCI and determine long or short positions based on the breakthrough direction.
Strategy Logic
The core logic of this strategy is:
- Define two CCIs, ci1 as 14 periods, ci2 as 56 periods
- When ci1 breaks above ci2, go long
- When ci1 breaks below ci2, go short
- Use the values of ci1 and ci2 to determine exits after signals triggered
Specific long rules:
- ci1 breaks above ci2, the shorter period CCI above longer period CCI
- Stop loss condition: ci1 <-50 and change rate < 0 or ci1 breaks below -100
Specific short rules:
- ci1 breaks below ci2, the shorter period CCI below longer period CCI
- Stop loss condition: ci1 > 100 and change rate > 0 or ci2 breaks above 100
As we can see, this strategy takes advantage of the sensitivity of shorter period CCI and the stability of longer period CCI to identify and follow trends.
Advantages
The advantages of this strategy:
- Effectively identifies trends using the strength of CCI indicator
- Dual CCI design filters some noise trades
- The combination of long and short period CCIs controls risk while following trends
- Simple and clear strategy rules, easy to understand and implement
- Highly configurable, both CCI periods and stop loss conditions are customizable
Risks
There are also some risks:
- Weak ability to identify range-bound and volatile markets using CCI
- Divergence may happen between long and short period CCIs, causing wrong signals
- Improper stop loss setting may lead to huge loss
- Inappropriate parameter tuning also largely impacts strategy profitability
Solutions:
- Incorporate other indicators to determine market condition, avoid trading in volatile period
- Add filters to avoid errors from CCI divergence
- Optimize and test different stop loss levels
- Find suitable parameter sets through backtesting and tuning
Optimization Directions
Areas that the strategy can be further optimized:
- Add more indicators to build a more systematic trading system
- Test profitability difference between weekdays and sessions
- Search for better parameters using machine learning
- Tune parameters for different products
- Optimize entry and exit rules
Conclusion
In conclusion, this is a simple trend following strategy based on CCI crossover. It can effectively identify trend direction and follow trends. Meanwhile it controls risk via stop loss. This strategy is simple, practical, flexible in parameter tuning, and can serve as a starter quant strategy. It can be enhanced into more powerful system via further optimization and combination.
/*backtest
start: 2023-10-24 00:00:00
end: 2023-11-23 00:00:00
period: 1h
basePeriod: 15m
exchanges: [{"eid":"Futures_Binance","currency":"BTC_USDT"}]
*/

//@version=3
strategy(title="my work",calc_on_order_fills=true,currency=currency.USD, default_qty_type=strategy.percent_of_equity,commission_type=strategy.commission.percent)


source = close
shortlength=input(14)
longlength=input(56)
aa=input(2)
Ss=input(75)

//Cci part
ci1=cci(source,shortlength)   //4시간봉의 기본 cci
ci2=cci(source,longlength)   //4시간봉에서 12시봉의 cci 무빙측정

//오린간 선생님의 WT + ichimoku
len = input(10)
lenTurn = input(9)
lenStd = input(26)

wtm_e(so, l) =>
    esa = ema(so, l)
    d = ema(abs(so - esa), l)
    ci = (so - esa) / (0.015 * d)
    ema(ci, l*2+1)

alh(len) => avg(lowest(len), highest(len))
alh_src(src, len) => avg(lowest(src, len), highest(src, len))

wt = wtm_e(close,len)
turn = alh_src(wt, lenTurn)
std = alh_src(wt, lenStd)

cnt = 0
if wt > turn
    cnt:=cnt+1
if wt > std
    cnt:=cnt+1


//100,-100선
h0 = hline(100)
h1 = hline(-100)

//plot(ci,color=green)
// plot(k,color=green)
// plot(d,color=red)
plot(ci1,color=green)
plot(ci2,color=red)

plot(0,color=black)
plot(100,color=black)
plot(-100,color=black)

fill(h0,h1,color=purple,transp=95)

bgcolor(cnt==0 ? red : cnt==1 ? blue : cnt == 2 ? green : na, transp = Ss)

//기간조정

Fromday = input(defval=1, title="from day", minval=1, maxval=31)
FromMonth = input(defval=1, title="from month", minval=1, maxval=12)
FromYr = input(defval=2019, title="from yr", minval=1970)

Today = input(defval=13, title="to day", minval=1, maxval=31)
ToMonth = input(defval=12, title="to month", minval=1, maxval=12)
ToYr = input(defval=2019, title="to yr", minval=1970)

startDate = timestamp(FromYr, FromMonth, Fromday, 00, 00)
finishDate = timestamp(ToYr, ToMonth, Today, 00, 00)
Time_cond = true


/////롱

if  crossover(ci1,ci2) and change(ci2)>0 and Time_cond
    strategy.entry("go", strategy.long, comment="go")

strategy.close("go", (ci2<0 and ci1 <-50 and change(ci1)<0) or (crossunder(ci1,-100) and strategy.openprofit<0) and change(cnt)<0)


/////숏

if  (crossunder(ci1,ci2) and change(ci2)<0 and falling(ci1,aa)) and Time_cond
    strategy.entry("die", strategy.short, comment="die")

strategy.close("die", (ci2>0 and ci1 > 100 and change(ci1)>0) or (crossover(ci2,100) and strategy.openprofit<0) and change(cnt)>0)
- Twisted SMA Adaptive Crossover Long Line Strategy
- Dual Moving Average Arbitrage Strategy
- Quantitative Investment Strategy Based on Monthly Buy Date
- Weighted Standard Deviation Trading Strategy
- Triple Moving Average Quantitative Trading Strategy
- EMA Crossover Strategy
- Short-Term, Medium-Term and Long-Term EMA Crossover Trading Strategy
- Trend Following Strategy Based on Time Series Decomposition and Volume Weighted Bollinger Bands
- Detrended Price Oscillator Quantitative Trading Strategy
- Multi-indicator Trend Following Strategy
- T3-CCI Trend Tracking Strategy
- Cross Timeframe SuperTrend Breakout Strategy
- Momentum Reversal Moving Average Combination Strategy
- Dynamic Moving Average Retracement Martin Strategy
- Combo Momentum Reversal Dual-Rail Matching Strategy
- Ichimoku Cloud Quant Strategy
- Adaptive Take Profit and Stop Loss Strategy Based on Dual Time Frames and Momentum Indicators
- Multi-Period RSI Grid Trading Strategy
- Dual Exponential Moving Average Crossover Strategy
- Trend Tracking Moving Average RSI Strategy