概述
本策略综合运用多种技术指标,实现动量反转与双轨配对,形成交易信号。策略运用123形态判断反转点,与ergodic CSI指标形成配对信号,实现趋势跟踪。该策略旨在捕捉中短线趋势,获得较高盈利。
策略原理
该策略包含两部分:
- 123形态判断反转点
- ergodic CSI指标生成配对信号
123形态判断是通过最近3根K线的收盘价关系来判断价格反转。具体判断逻辑是: 如果前两根K线后一根收盘价上涨,且当前快慢stoch指标都低于50,则为买入信号。 如果前两根K线后一根收盘价下跌,且当前快慢stoch指标都高于50,则为卖出信号。
ergodic CSI指标考虑了价格、真实波幅、趋势指标等多因素,综合判断行情走势,生成买入卖出区域。 当指标高于买入区域时产生买入信号,低于卖出区域时产生卖出信号。
最后,123形态的反转信号与ergodic CSI的轨道信号进行“与”运算,得到最终策略信号。
策略优势
- 捕捉中短线趋势,盈利潜力较大
- 反转形态判断,可有效抓住转折点
- 双轨配对,可减少假信号
策略风险
- 个股行情可能出现背离,导致止损
- 反转形态容易受震荡市的影响
- 参数优化空间有限,效果波动大
优化方向
- 优化参数,提高策略盈利效果
- 增加止损逻辑,降低单笔亏损
- 结合多因子模型,提升选股质量
总结
本策略通过反转形态与双轨配对,实现了对中短线趋势的有效跟踪。相比单一技术指标,具有更高的稳定性和盈利水平。下一步将进一步优化参数,并增加止损与选股模块,以减少回撤和提高整体效果。
策略源码
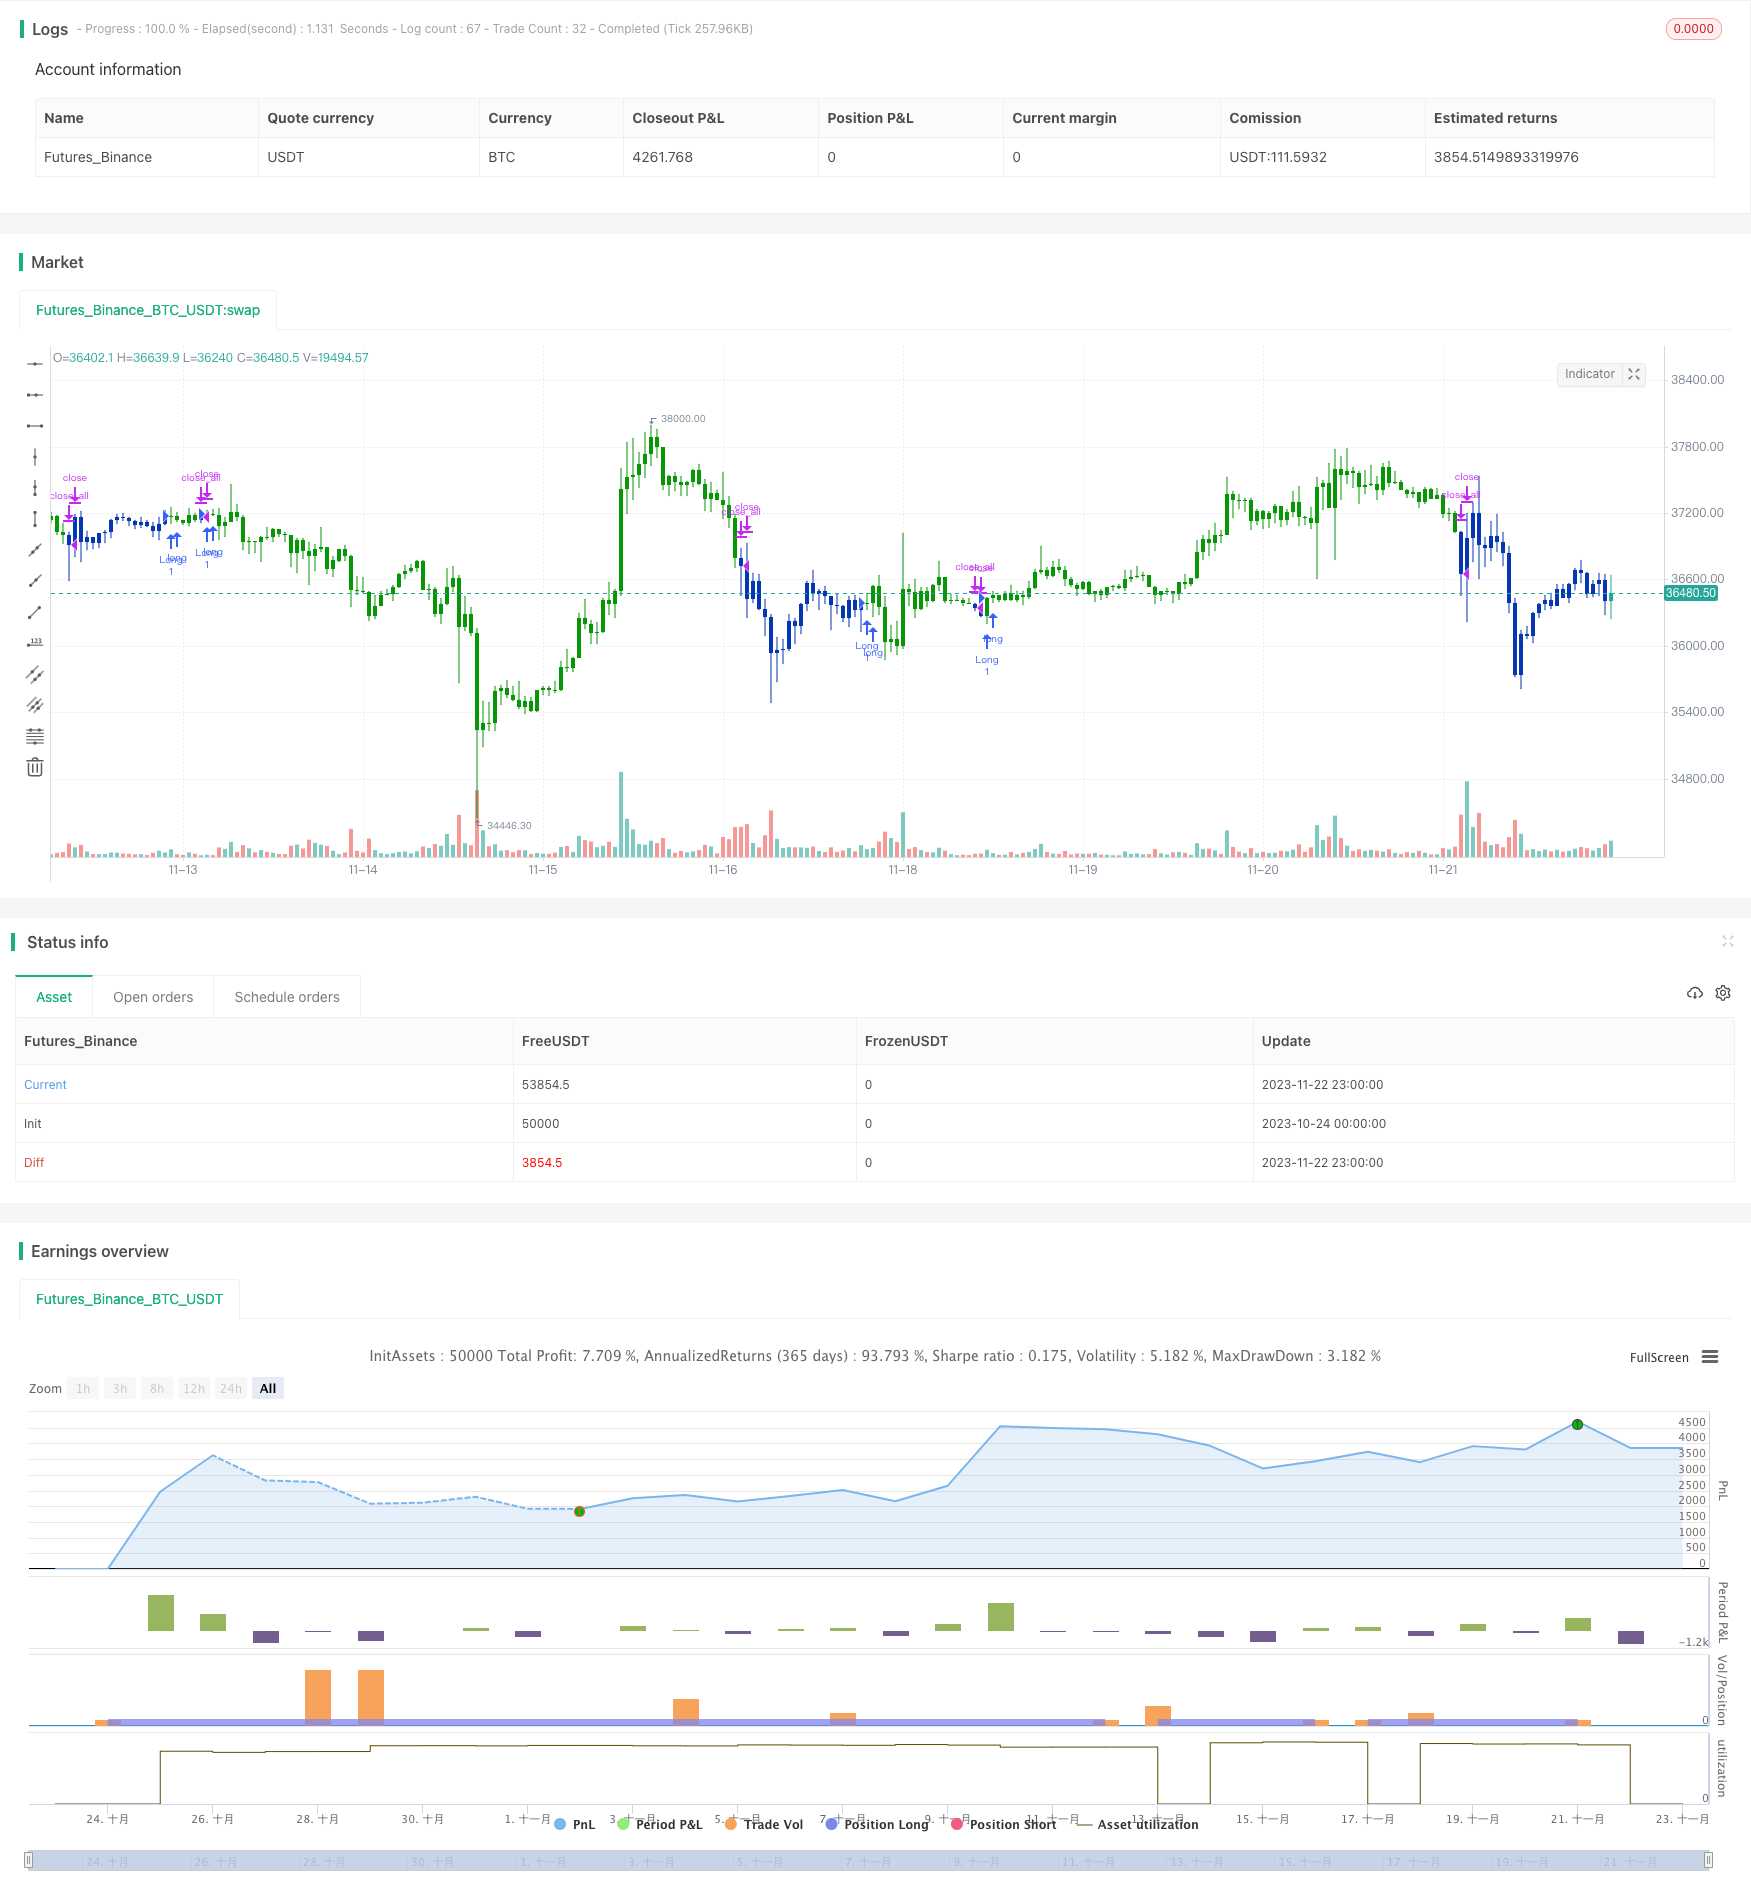
/*backtest
start: 2023-10-24 00:00:00
end: 2023-11-23 00:00:00
period: 1h
basePeriod: 15m
exchanges: [{"eid":"Futures_Binance","currency":"BTC_USDT"}]
*/

//@version=4
////////////////////////////////////////////////////////////
//  Copyright by HPotter v1.0 22/07/2020
// This is combo strategies for get a cumulative signal.
//
// First strategy
// This System was created from the Book "How I Tripled My Money In The
// Futures Market" by Ulf Jensen, Page 183. This is reverse type of strategies.
// The strategy buys at market, if close price is higher than the previous close
// during 2 days and the meaning of 9-days Stochastic Slow Oscillator is lower than 50.
// The strategy sells at market, if close price is lower than the previous close price
// during 2 days and the meaning of 9-days Stochastic Fast Oscillator is higher than 50.
//
// Second strategy
// This is one of the techniques described by William Blau in his book
// "Momentum, Direction and Divergence" (1995). If you like to learn more,
// we advise you to read this book. His book focuses on three key aspects
// of trading: momentum, direction and divergence. Blau, who was an electrical
// engineer before becoming a trader, thoroughly examines the relationship between
// price and momentum in step-by-step examples. From this grounding, he then looks
// at the deficiencies in other oscillators and introduces some innovative techniques,
// including a fresh twist on Stochastics. On directional issues, he analyzes the
// intricacies of ADX and offers a unique approach to help define trending and
// non-trending periods.
// This indicator plots Ergotic CSI and smoothed Ergotic CSI to filter out noise.
//
// WARNING:
// - For purpose educate only
// - This script to change bars colors.
////////////////////////////////////////////////////////////
Reversal123(Length, KSmoothing, DLength, Level) =>
    vFast = sma(stoch(close, high, low, Length), KSmoothing)
    vSlow = sma(vFast, DLength)
    pos = 0.0
    pos := iff(close[2] < close[1] and close > close[1] and vFast < vSlow and vFast > Level, 1,
	         iff(close[2] > close[1] and close < close[1] and vFast > vSlow and vFast < Level, -1, nz(pos[1], 0)))
	pos

fADX(Len) =>
    up = change(high)
    down = -change(low)
    trur = rma(tr, Len)
    plus = fixnan(100 * rma(up > down and up > 0 ? up : 0, Len) / trur)
    minus = fixnan(100 * rma(down > up and down > 0 ? down : 0, Len) / trur)
    sum = plus + minus
    100 * rma(abs(plus - minus) / (sum == 0 ? 1 : sum), Len)

ECSI(r,Length,BigPointValue,SmthLen,SellZone,BuyZone) =>
    pos = 0
    source = close
    K = 100 * (BigPointValue / sqrt(r) / (150 + 5))
    xTrueRange = atr(1)
    xADX = fADX(Length)
    xADXR = (xADX + xADX[1]) * 0.5
    nRes = iff(Length + xTrueRange > 0, K * xADXR * xTrueRange / Length,0)
    xCSI = iff(close > 0,  nRes / close, 0)
    xSMA_CSI = sma(xCSI, SmthLen)
    pos := iff(xSMA_CSI > BuyZone, 1,
             iff(xSMA_CSI <= SellZone, -1, nz(pos[1], 0)))
    pos

strategy(title="Combo Backtest 123 Reversal & Ergodic CSI", shorttitle="Combo", overlay = true)
Length = input(14, minval=1)
KSmoothing = input(1, minval=1)
DLength = input(3, minval=1)
Level = input(50, minval=1)
//-------------------------
r = input(32, minval=1)
LengthECSI = input(1, minval=1)
BigPointValue = input(1.0, minval=0.00001)
SmthLen = input(5, minval=1)
SellZone = input(0.06, minval=0.00001)
BuyZone = input(0.02, minval=0.001)
reverse = input(false, title="Trade reverse")
posReversal123 = Reversal123(Length, KSmoothing, DLength, Level)
posECSI = ECSI(r,LengthECSI,BigPointValue,SmthLen,SellZone,BuyZone)
pos = iff(posReversal123 == 1 and posECSI == 1 , 1,
	   iff(posReversal123 == -1 and posECSI == -1, -1, 0))
possig = iff(reverse and pos == 1, -1,
          iff(reverse and pos == -1 , 1, pos))
if (possig == 1)
    strategy.entry("Long", strategy.long)
if (possig == -1)
    strategy.entry("Short", strategy.short)
if (possig == 0)
    strategy.close_all()
barcolor(possig == -1 ? #b50404: possig == 1 ? #079605 : #0536b3 )