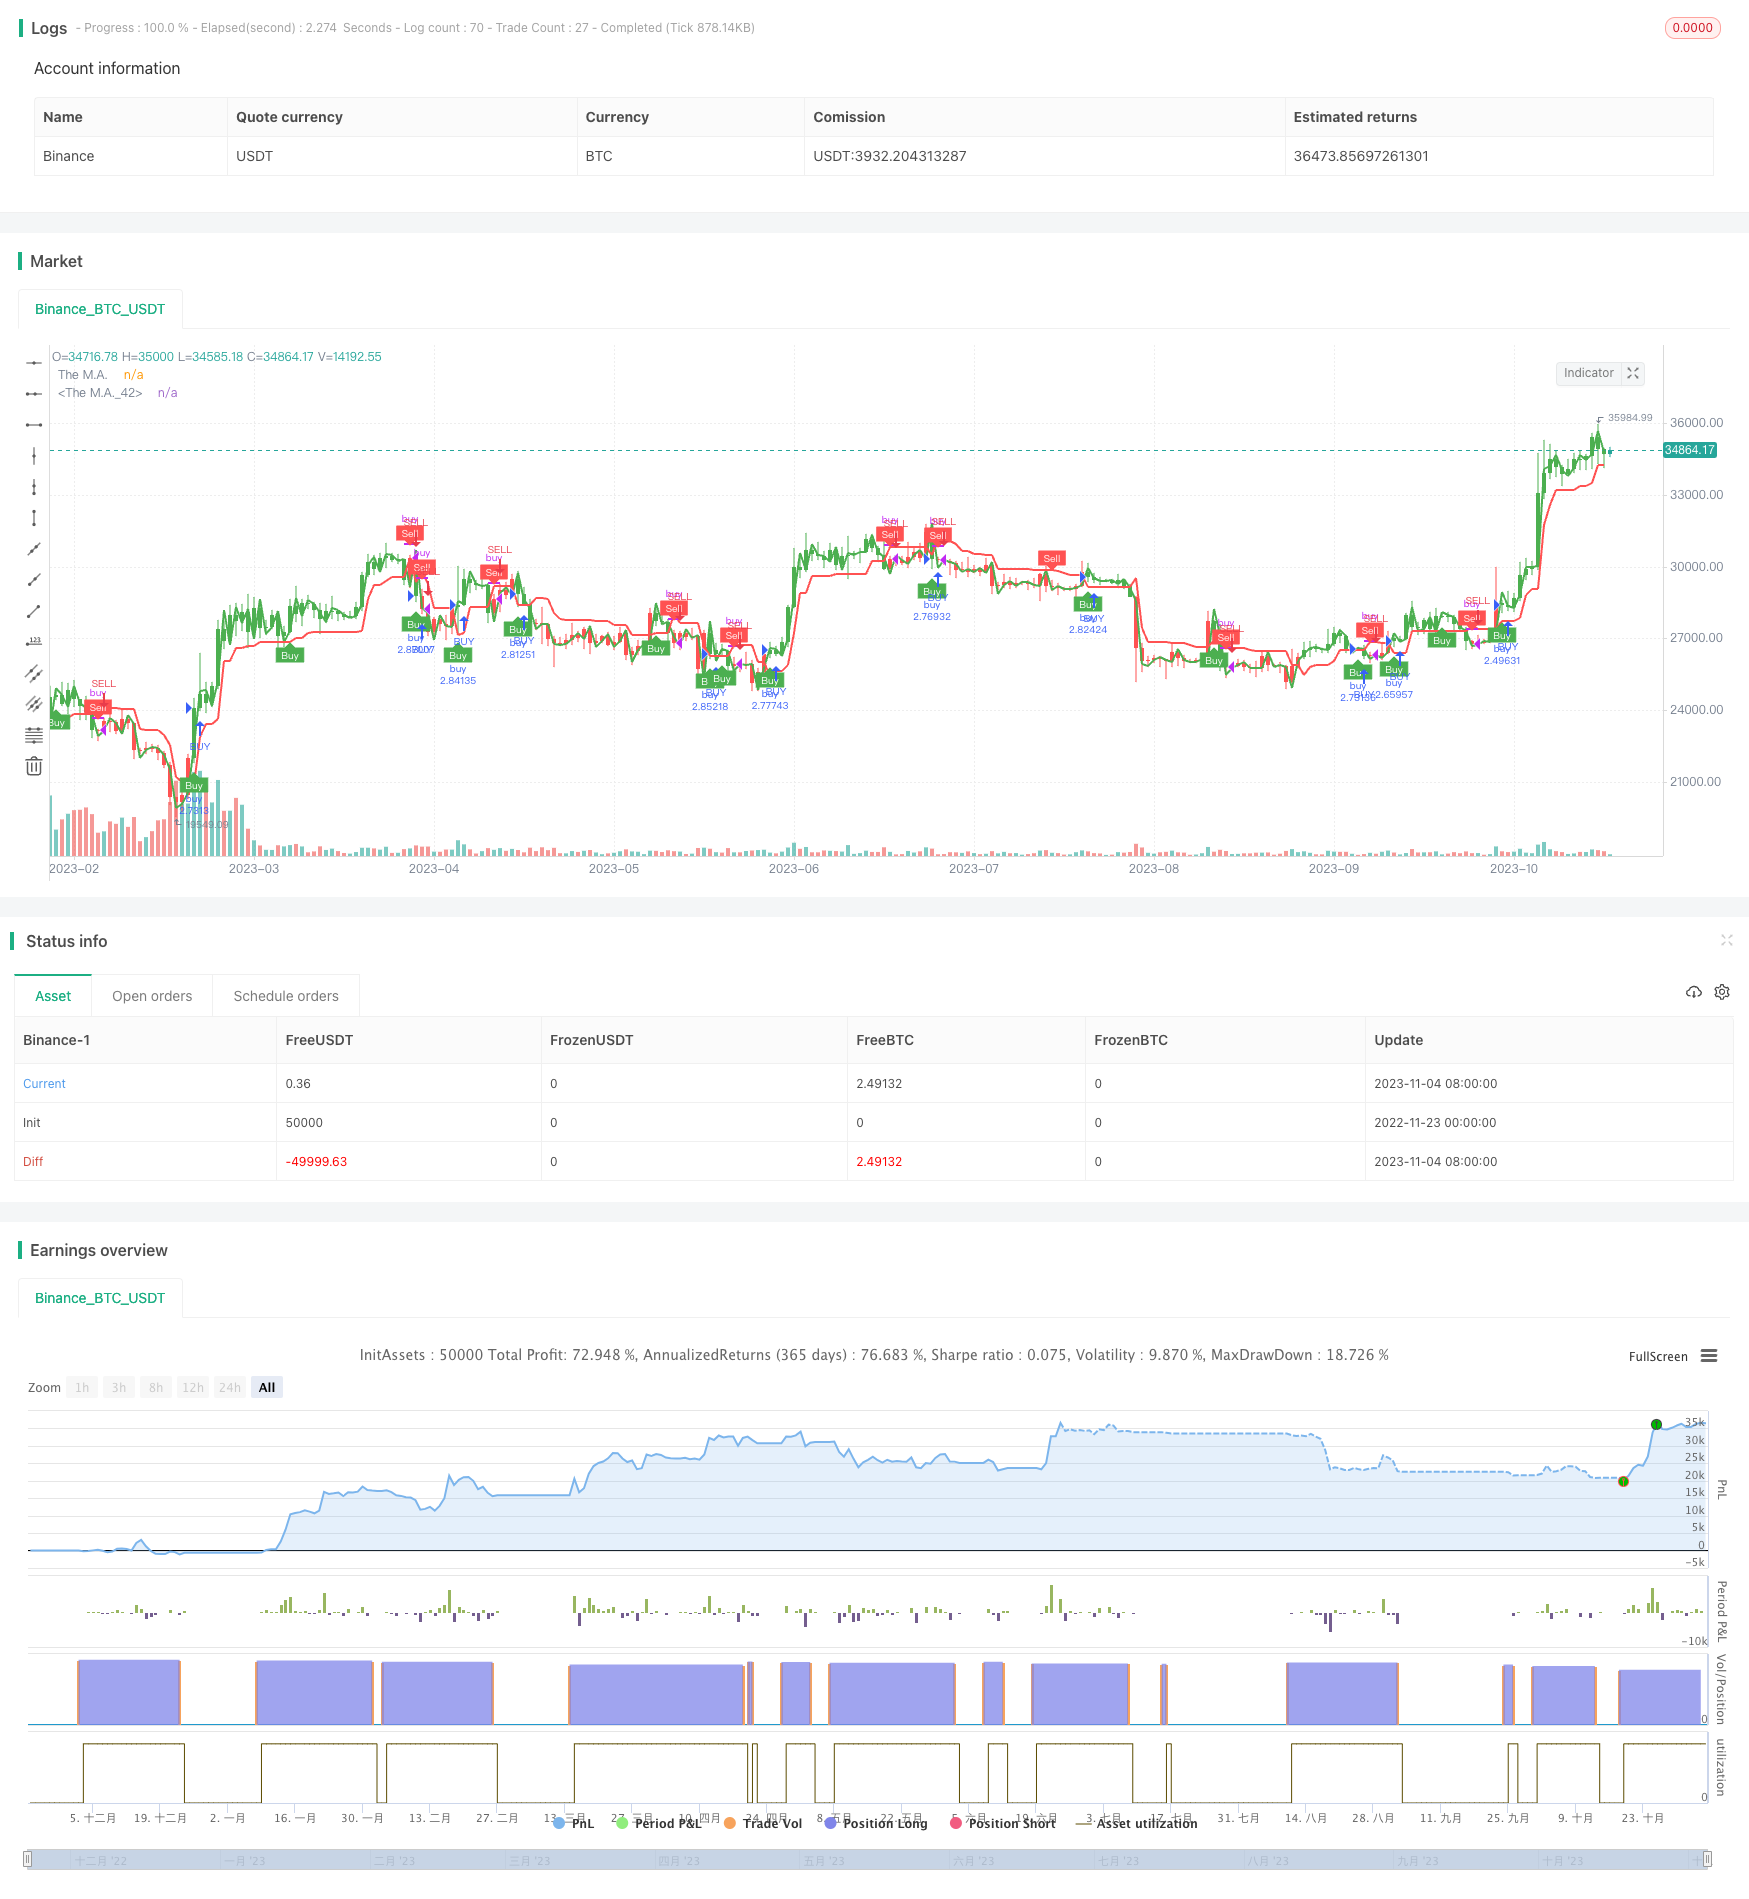
Dynamic Moving Average Tracking Strategy
Author: ChaoZhang, Date: 2023-11-24 16:59:25Tags:

Overview
The core idea of this strategy is to use dynamic moving average for trend tracking, set stop loss and take profit, and combine Heikin Ashi candlestick techniques for long/short signal judgment. ATR indicator is used to calculate the dynamic moving average and stop loss position.
Principles
The strategy first calculates the ATR indicator, then combines the input price source and parameters to compute the dynamic moving average. Long/short signals are generated when price crosses above/below the dynamic moving average. Meanwhile, stop loss and take profit positions are set to track price changes in real time.
Specifically, ATR indicator and parameter nLoss are calculated first. Then current period’s price and previous period’s stop loss position are compared to update the stop loss line. When price breaks through previous period’s stop loss line, long/short signals pos and corresponding colors are generated. When trading signals are triggered, arrow markings are plotted. Finally positions are closed based on stop loss/take profit logic.
Advantage Analysis
The biggest advantage of this strategy is the use of dynamic moving average to track price changes in real time. This captures trends better than traditional fixed moving averages and reduces chances of stop loss. Additionally, combining ATR based stop loss allows flexible adjustment of stop loss position based on market volatility to effectively control risks.
Risks and Solutions
The main risk of this strategy is that price may gap up/down significantly, causing false signals when stop loss is hit. Also, improper condition settings may lead to overly frequent trading.
Solutions include optimizing moving average period, adjusting ATR and stop loss coefficient to lower probability of false signals. Additional filters can be added to avoid overly dense trades.
Optimization Directions
The strategy can be optimized in the following aspects:
-
Test different types and periods of moving averages to find optimal parameter combinations
-
Optimize ATR period parameter to balance stop loss sensitivity
-
Add extra filters and indicators to improve signal quality
-
Adjust stop loss/take profit values to optimize risk reward ratio
Conclusion
The core idea of this strategy is to use dynamic moving average to track price changes in real time, utilizing ATR indicator to dynamically set stop loss positions, controlling risk strictly while tracking trends. Through parameter optimization and rule refinement, this strategy can be tuned into a highly practical quantitative system.
/*backtest
start: 2022-11-23 00:00:00
end: 2023-11-05 05:20:00
period: 1d
basePeriod: 1h
exchanges: [{"eid":"Binance","currency":"BTC_USDT","stocks":0}]
*/

//@version=5
strategy(title='UT Bot v5', overlay=true, default_qty_type=strategy.percent_of_equity, default_qty_value=100)
//CREDITS to HPotter for the orginal code. The guy trying to sell this as his own is a scammer lol.
//Edited and converted to @version=5 by SeaSide420 for Paperina
// Inputs
AllowBuy = input(defval=true, title='Allow Buy?')
AllowSell = input(defval=false, title='Allow Sell?')
h = input(false, title='Signals from Heikin Ashi Candles')
//revclose = input(defval=true, title='Close when reverse signal?')
Price = input(defval=open, title='Price Source (recommended OPEN to avoid repainting)')
smoothing = input.string(title="Moving Average Type", defval="HMA", options=["SMA", "EMA", "WMA", "HMA"])
MA_Period = input(2, title='This changes the MAPeriod')
a = input.float(1, title='This changes the sensitivity',step=0.1)
c = input(11, title='ATR Period')
TakeProfit = input.int(defval=50000, title='Take Profit ($)', minval=1)
StopLoss = input.int(defval=50000, title='Stop Loss ($)', minval=1)
xATR = ta.atr(c)
nLoss = a * xATR
src = h ? request.security(ticker.heikinashi(syminfo.tickerid), timeframe.period, Price, lookahead=barmerge.lookahead_off) : Price
xATRTrailingStop = 0.0
iff_1 = src > nz(xATRTrailingStop[1], 0) ? src - nLoss : src + nLoss
iff_2 = src < nz(xATRTrailingStop[1], 0) and src[1] < nz(xATRTrailingStop[1], 0) ? math.min(nz(xATRTrailingStop[1]), src + nLoss) : iff_1
xATRTrailingStop := src > nz(xATRTrailingStop[1], 0) and src[1] > nz(xATRTrailingStop[1], 0) ? math.max(nz(xATRTrailingStop[1]), src - nLoss) : iff_2
pos = 0
iff_3 = src[1] > nz(xATRTrailingStop[1], 0) and src < nz(xATRTrailingStop[1], 0) ? -1 : nz(pos[1], 0)
pos := src[1] < nz(xATRTrailingStop[1], 0) and src > nz(xATRTrailingStop[1], 0) ? 1 : iff_3
xcolor = pos == -1 ? color.red : pos == 1 ? color.green : color.blue
ma_function(src, MA_Period) =>
    switch smoothing
        "SMA" => ta.sma(src, MA_Period)
        "EMA" => ta.ema(src, MA_Period)
        "WMA" => ta.wma(src, MA_Period)
        => ta.hma(src, MA_Period)
thema = ma_function(src, MA_Period)
above = ta.crossover(thema, xATRTrailingStop)
below = ta.crossover(xATRTrailingStop, thema)
buy = src > xATRTrailingStop and above
sell = src < xATRTrailingStop and below
barbuy = src > xATRTrailingStop
barsell = src < xATRTrailingStop
plot(thema,title="The M.A.",color=color.green,linewidth=2)
plot(xATRTrailingStop,title="The M.A.",color=color.red,linewidth=2)
plotshape(buy,  title = "Buy",  text = "Buy",  style = shape.labelup,   location = location.belowbar, color= color.green, textcolor = color.white, size = size.tiny)
plotshape(sell, title = "Sell", text = "Sell", style = shape.labeldown, location = location.abovebar, color= color.red,   textcolor = color.white, size = size.tiny)
barcolor(barbuy ? color.green : na)
barcolor(barsell ? color.red : na)
strategy.close_all(when=strategy.openprofit>TakeProfit,alert_message="Close- TakeProfit", comment = "TP")
strategy.close_all(when=strategy.openprofit<StopLoss-(StopLoss*2),alert_message="Close- StopLoss", comment = "SL")
strategy.close("buy", when =  sell and AllowSell==false , comment = "close buy")
strategy.close("sell", when =  buy and AllowBuy==false, comment = "close sell")
strategy.entry("buy", strategy.long, when = buy and AllowBuy)
strategy.entry("sell", strategy.short, when = sell and AllowSell)
- Price Momentum Tracking Stop Loss Strategy
- Price Reversal Strategy Guided by Price Channel
- KST Indicator Profit Strategy
- Dynamic Two-way Add Position Strategy
- Relative Strength Index Flat Reversal Strategy
- Fast RSI Gap Trading Strategy for Cryptocurrencies
- KDJ RSI Crossover Buy Sell Signals Strategy
- Ichimoku Backtester with TP, SL, and Cloud Confirmation
- Gyroscopic Bands Strategy Based on Multi Time Frame and Average Amplitude
- Dual Moving Average Crossover Reversal Strategy
- Reversal-Catcher Strategy
- RSI Gap Reversal Strategy
- 3-Min Short Only Expert Advisor Strategy
- Action Zone ATR Reverse Order Quant Strategy
- MACD Trend Following Strategy
- Momentum Analysis Ichimoku Cloud Fog Lightning Trading Strategy
- Traffic Light Trading Strategy Based on EMA
- Dual Moving Average Matching Strategy Based on Bollinger Bands
- Inverse Las Vegas Algorithmic Trading Strategy
- Solid Moving Average System Strategy