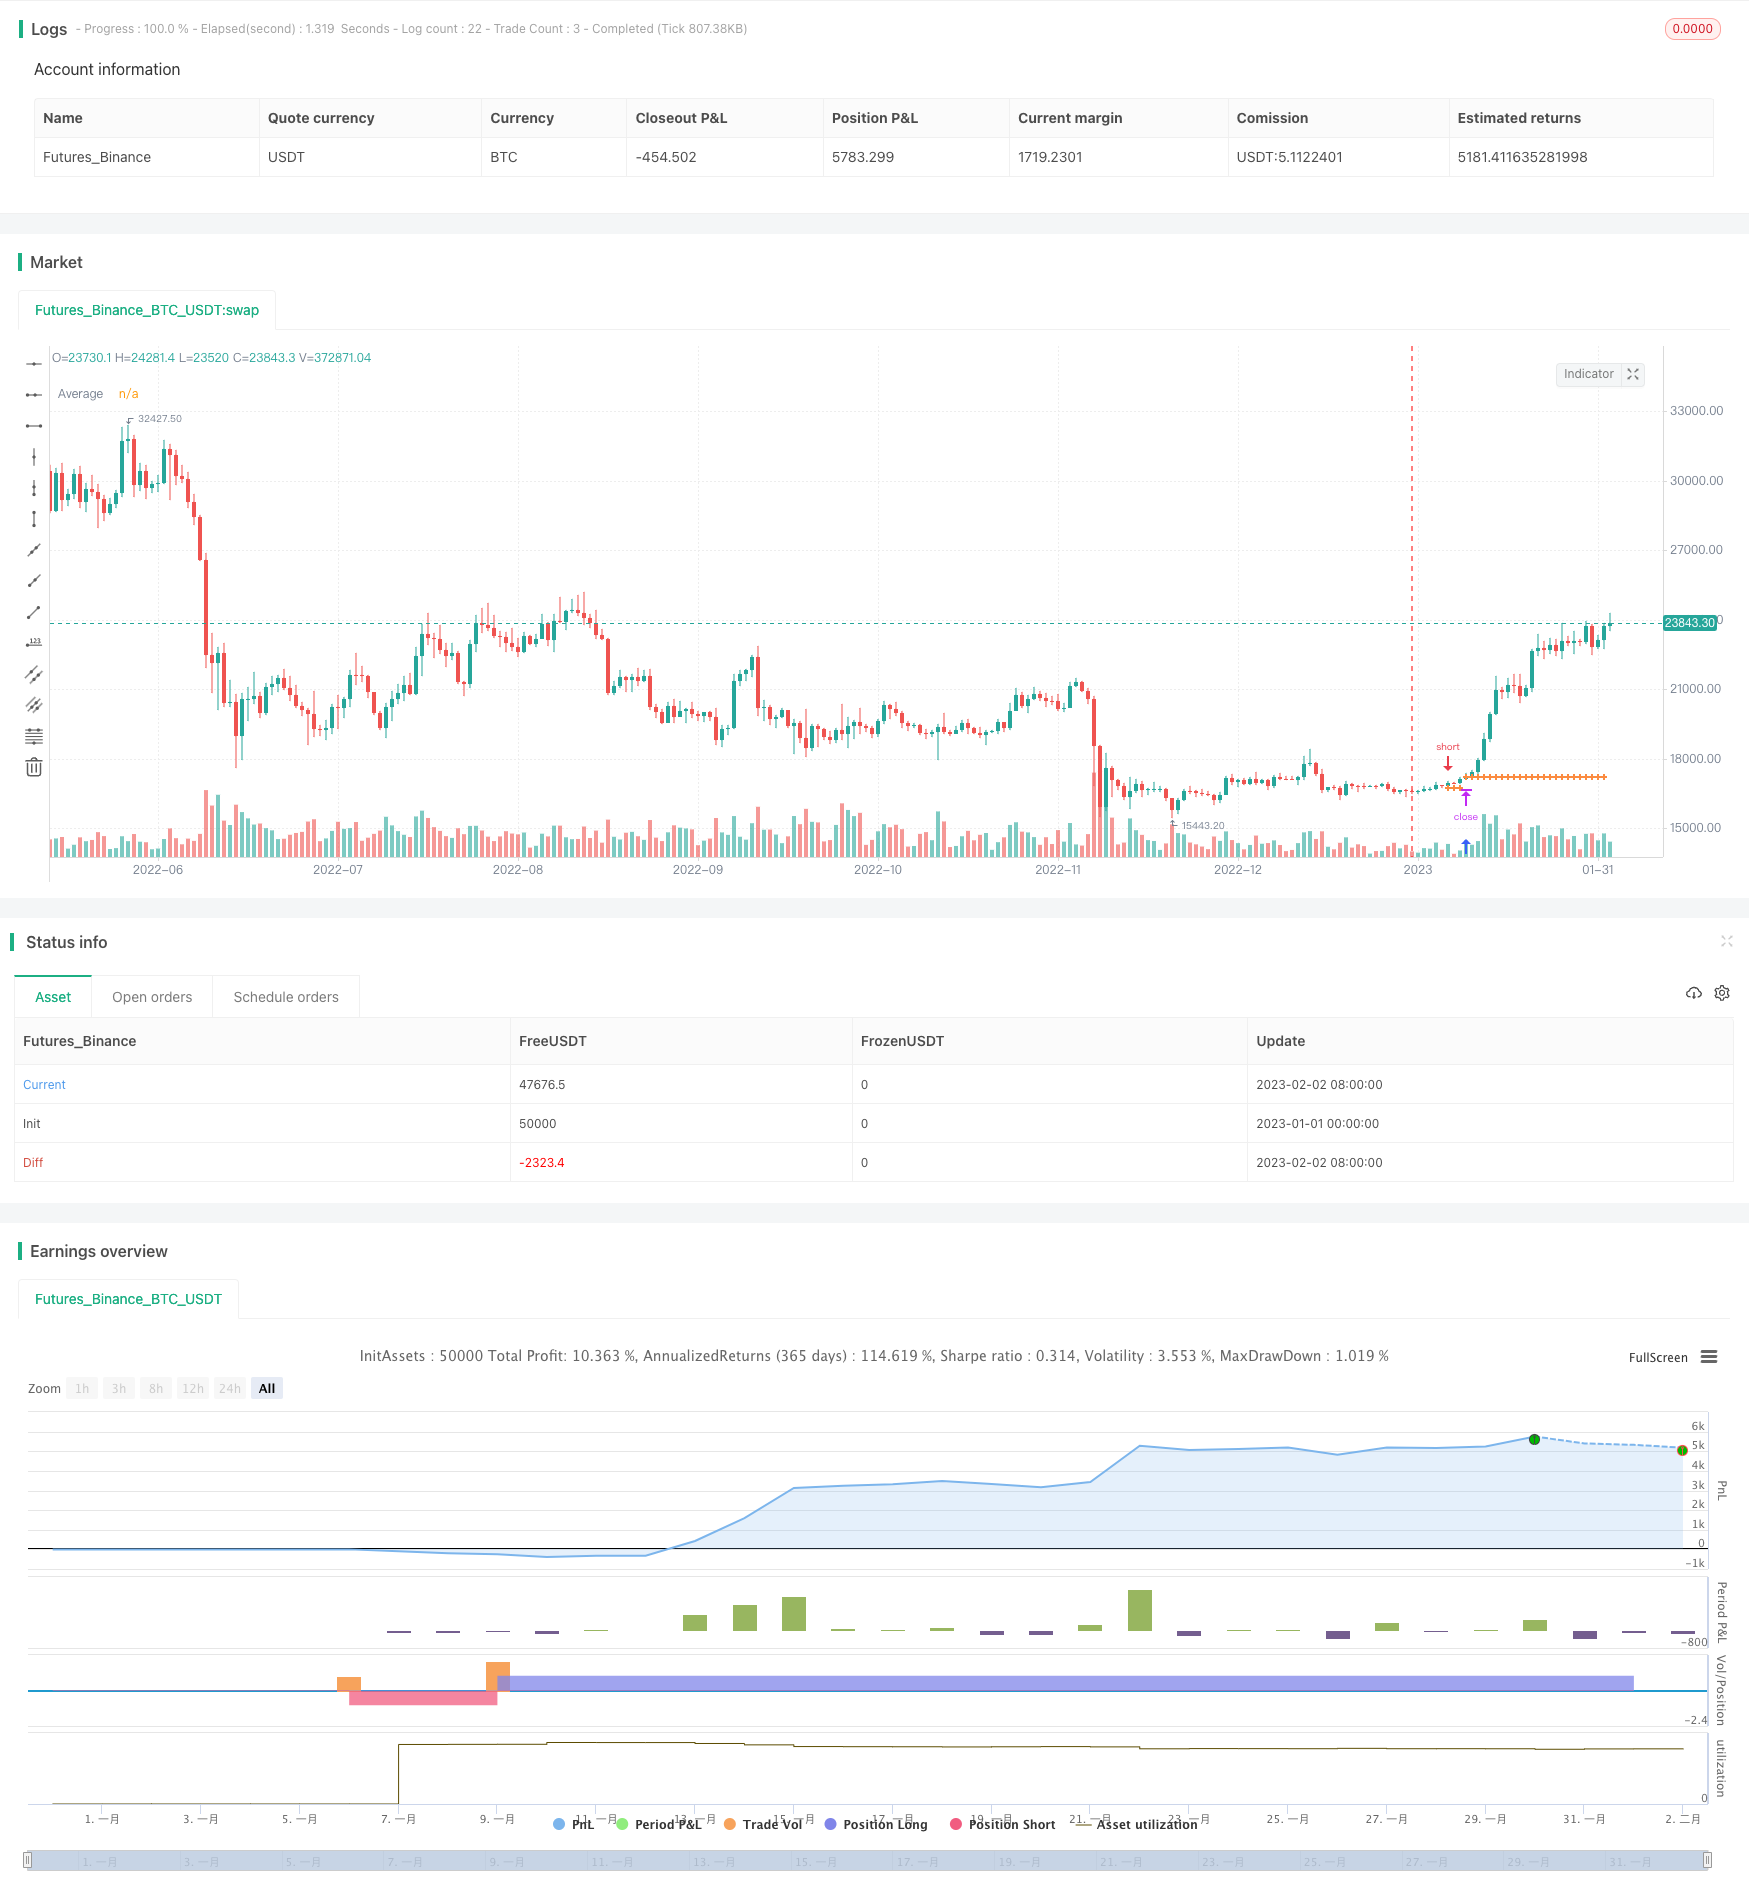
概述
本策略通过计算价格的动量指标,设定长短双向追踪止损来锁定利润,从而实现趋势跟踪止损。策略同时结合激活水平,在达到指定盈利后才开始追踪止损,可有效防止过早止损。
策略原理
计算价格的12周期动量,再计算动量的1周期动量。当快速动量(价格动量的1周期动量)大于0时做多,小于0时做空。这样可以判断价格动量变化的方向,掌握价格趋势。
设置追踪止损距离和追踪止损激活水平。追踪止损距离是指当价格运行到新的高点或低点时,调整止损到指定的距离。追踪止损激活是指必须达到一定盈利比例后才开始追踪止损。
策略通过追踪最高价或最低价来锁定利润,当价格回落超过设置的止损距离时,发出平仓信号。
策略优势分析
利用双重动量判断,可准确判断价格趋势方向,减少交易次数,避免被套。
可灵活设置追踪止损距离,降低风险,锁定利润。
可设置追踪止损激活水平,只有达到一定盈利后才启动止损机制,避免过早止损。
可同时设置多头和空头的止损水平,全面控制风险。
计算过程简单高效,容易理解和实现。
策略风险分析
双重动量判断可能出现反向信号,需要结合趋势过滤。
止损距离设置过大 may cause significant losses。
激活水平设置过高可能错过止损机会。
需要更多参数测试和优化,以找到最佳止损点。
可通过趋势判断和参数优化来减少误信号。测试不同品种合约和参数设置,寻找最佳配置。
策略优化方向
结合市场结构识别指标,确定多空趋势,避免反向交易。
加入更多择时条件,如交易量变化,缩量突破等,提高信号准确率。
进行参数优化,测试不同止损距离和激活水平的表现。
考虑动态追踪止损距离,根据市场波动度自动调整。
可设置部分止损或移动止损,进一步控制风险。
总结
本策略整体结构清晰,通过双重动量指标判断价格趋势,设定灵活的追踪止损来锁定利润,可有效控制交易风险。策略易于理解和实现,同时存在可优化空间,加入更多技术指标和参数测试可进一步提升策略表现。本策略可为实现止损管理提供思路和参考。
/*backtest
start: 2023-01-01 00:00:00
end: 2023-02-03 00:00:00
period: 1d
basePeriod: 1h
exchanges: [{"eid":"Futures_Binance","currency":"BTC_USDT"}]
*/

//@version=5
strategy("Trailing Stop Snippet", overlay=true)

length = input(12)
price = close
momentum(seria, length) =>
	mom = seria - seria[length]
	mom
mom0 = momentum(price, length)
mom1 = momentum( mom0, 1)

tsact = input.float(0.0, "Trailing Stop Activation |", group="strategy", tooltip="Activates the Trailing Stop once this PnL is reached.") / 100
tsact := tsact ? tsact : na
ts = input.float(0.0, "Position Trailing Stop |", group="strategy", tooltip="Trails your position with a stop loss at this distance from the highest PnL") / 100
ts := ts ? ts : na

in_long = strategy.position_size > 0
in_short = strategy.position_size < 0

var ts_ = array.new_float()
ts_size = array.size(ts_)
ts_get = ts_size > 0 ? array.get(ts_, ts_size - 1) : 0

if in_long
    if tsact and high > strategy.position_avg_price + strategy.position_avg_price * tsact
        if ts_size > 0 and ts_get < high
            array.push(ts_, high)
        if ts_size < 1
            array.push(ts_, high)
    if not tsact
        if ts_size > 0 and ts_get < high
            array.push(ts_, high)
        if ts_size < 1
            array.push(ts_, high)
if in_short
    if tsact and low < strategy.position_avg_price - strategy.position_avg_price * tsact
        if ts_size > 0 and ts_get > low
            array.push(ts_, low)
        if ts_size < 1
            array.push(ts_, low)
    if not tsact
        if ts_size > 0 and ts_get > low
            array.push(ts_, low)
        if ts_size < 1
            array.push(ts_, low)

trail = in_long and ts_size > 0 ? low < ts_get - ts_get * ts : in_short and ts_size > 0 ? high > ts_get + ts_get * ts : na

if (mom0 > 0 and mom1 > 0)
	strategy.entry("MomLE", strategy.long, stop=high+syminfo.mintick, comment="MomLE")
else
	strategy.cancel("MomLE")
if (mom0 < 0 and mom1 < 0)
	strategy.entry("MomSE", strategy.short, stop=low-syminfo.mintick, comment="MomSE")
else
	strategy.cancel("MomSE")

tsClose = in_long ? ts_get - ts_get * ts : in_short ? ts_get + ts_get * ts : na
if trail
    strategy.close_all()
if not strategy.opentrades
	array.clear(ts_)

//plot(strategy.equity, title="equity", color=color.red, linewidth=2, style=plot.style_areabr)

plotchar(ts_get, "GET", "")
plot(strategy.position_avg_price > 0 ? strategy.position_avg_price : na, "Average", color.rgb(251, 139, 64), 2, plot.style_cross)
plot(tsClose > 0 ? tsClose : na, "Trailing", color.rgb(251, 64, 64), 2, plot.style_cross)
plot(strategy.position_avg_price - strategy.position_avg_price * tsact > 0 ? strategy.position_avg_price - strategy.position_avg_price * tsact : na, "TS Activation", color.fuchsia, 2, plot.style_cross)