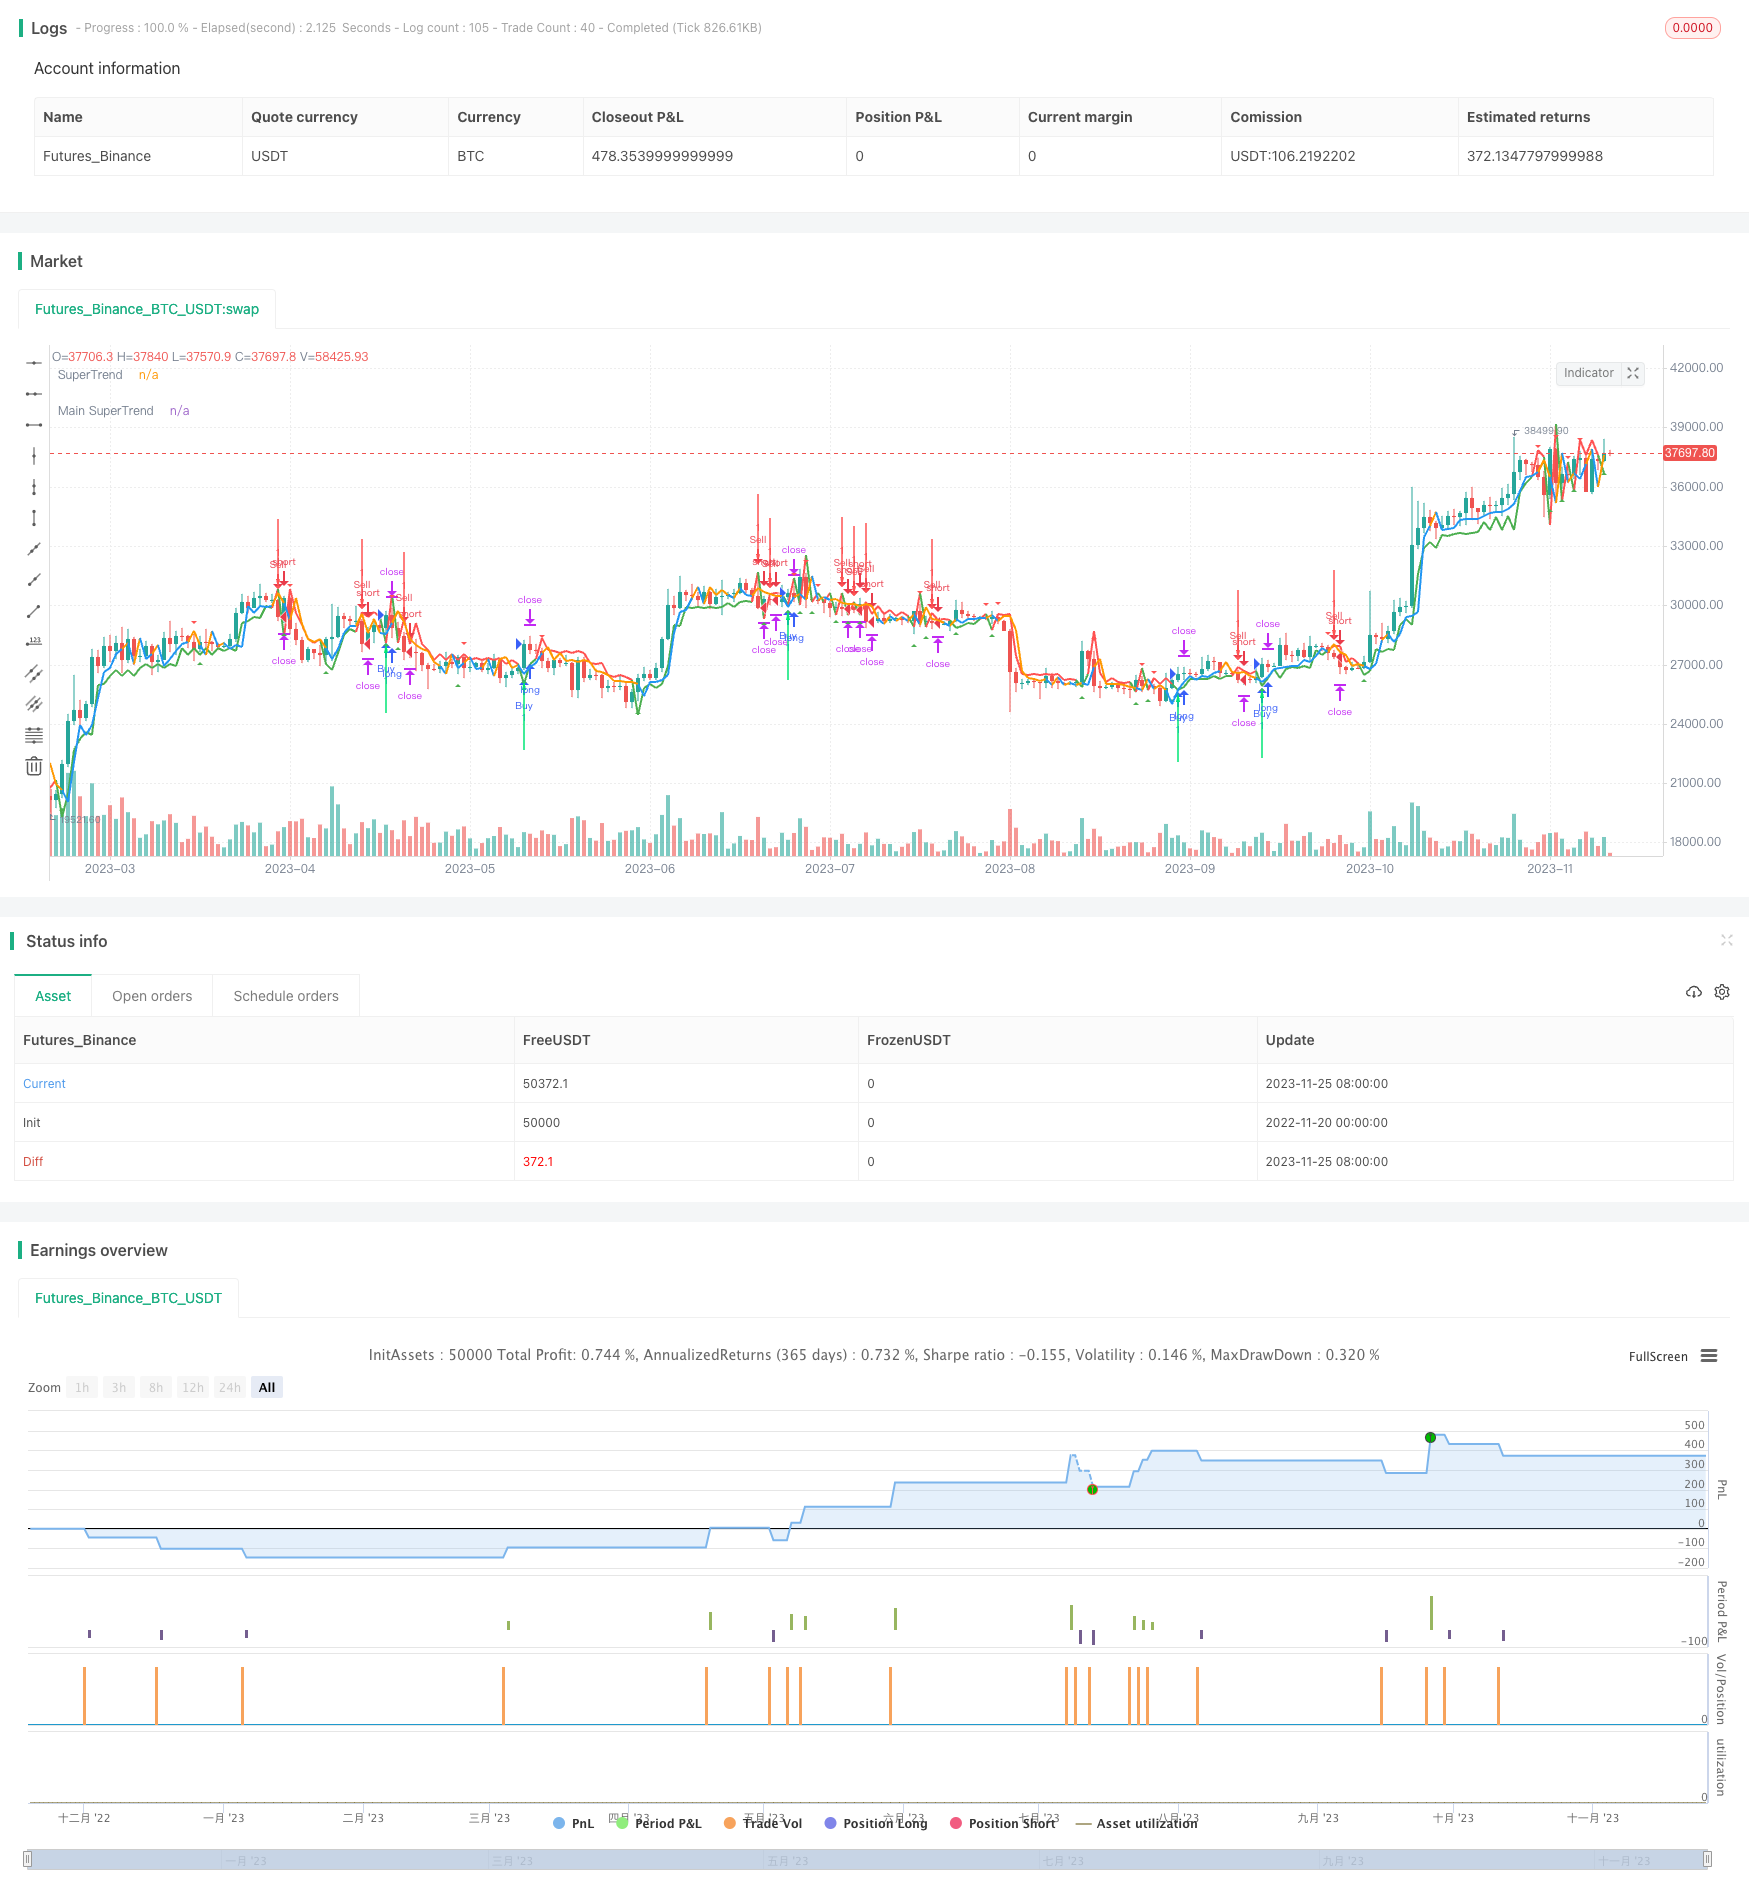
Overview
The dual moving average oscillation breakthrough strategy calculates two moving averages of different periods to form a channel and judge the oscillating trend of prices. It generates trading signals when prices break through the channel. This strategy also incorporates mainstream market direction judgment to avoid false breakthroughs.
Strategy Principle
The main steps of this strategy are:
Calculate two moving averages, one with a shorter period and one with a longer period. The shorter MA reflects current price trend and the longer MA reflects mainstream price trend.
Add one ATR above and below the shorter MA to form a channel. ATR reflects current market volatility.
A buy signal is generated when price breaks through the channel upwards. A sell signal is generated when price breaks through the channel downwards.
Incorporate mainstream trend judgment. Valid trading signals are only generated when short term breakthrough aligns with mainstream trend direction.
By following these steps, this strategy captures breakthrough points in oscillating trends and avoids false signals by referring to the mainstream trend.
Advantage Analysis
The advantages of this strategy:
The dual MA channel reflects the current price oscillation range.
ATR parameter enables the channel range to track market volatility in real time.
Mainstream trend filtering avoids false signals in oscillating markets.
The rules are simple and easy to understand. Suitable for learning and researching.
Risk Analysis
The risks:
Failed breakthroughs may lead to missing good opportunities. Can be mitigated by profit taking and re-entry.
Mainstream trend judgment has time lag and cannot eliminate all false signals. Can optimize MA parameters.
Stop loss may be penetrated in volatile markets. Can adjust ATR dynamically.
Optimization Directions
Ways to optimize this strategy:
Optimize MA parameters for different products.
Optimize ATR parameter to better track volatility.
Add additional filters like volume and volatility indicators to further avoid false signals.
Use machine learning to automatically optimize parameters.
Conclusion
This dual MA oscillation breakthrough strategy captures oscillating trends through the double MA channel and mainstream filtering. With its simple and clear rules, it is an excellent example to learn breakthrough trading strategies. Further optimizations in parameters and signal filtering can enhance its profitability and stability.
/*backtest
start: 2022-11-20 00:00:00
end: 2023-11-26 00:00:00
period: 1d
basePeriod: 1h
exchanges: [{"eid":"Futures_Binance","currency":"BTC_USDT"}]
*/

//Anuj4912
//@version=4
strategy("Anuj4912", overlay=true)
res = input(title="Time Frame",  defval="120")
Factor=input(1, minval=1,maxval = 100)
Pd=input(1, minval=1,maxval = 100)

tp = input(500,title="Take Profit")
sl = input(400,title="Stop Loss")


Up=hl2-(Factor*atr(Pd))
Dn=hl2+(Factor*atr(Pd))
MUp=request.security(syminfo.tickerid,res,hl2-(Factor*atr(Pd)))
MDn=request.security(syminfo.tickerid,res,hl2+(Factor*atr(Pd)))

Mclose=request.security(syminfo.tickerid,res,close)

TrendUp=close[1]>TrendUp[1]? max(Up,TrendUp[1]) : Up
TrendDown=close[1]<TrendDown[1]? min(Dn,TrendDown[1]) : Dn

MTrendUp=Mclose[1]>MTrendUp[1]? max(MUp,MTrendUp[1]) : MUp
MTrendDown=Mclose[1]<MTrendDown[1]? min(MDn,MTrendDown[1]) : MDn

Trend = close > TrendDown[1] ? 1: close< TrendUp[1]? -1: nz(Trend[1],1)
Tsl = Trend==1? TrendUp: TrendDown

MTrend = Mclose > MTrendDown[1] ? 1: Mclose< MTrendUp[1]? -1: nz(MTrend[1],1)
MTsl = MTrend==1? MTrendUp: MTrendDown

linecolor = Trend == 1 ? green : red
plot(Tsl, color = linecolor , style = line , linewidth = 2,title = "SuperTrend")

Mlinecolor = MTrend == 1 ? blue : orange
plot(MTsl, color = Mlinecolor , style = line , linewidth = 2,title = "Main SuperTrend")

plotshape(cross(close,Tsl) and close>Tsl , "Up Arrow", shape.triangleup,location.belowbar,green,0,0)
plotshape(cross(Tsl,close) and close<Tsl , "Down Arrow", shape.triangledown , location.abovebar, red,0,0)

up = Trend == 1 and Trend[1] == -1 and MTrend == 1
down = Trend == -1 and Trend[1] == 1 and MTrend == -1
plotarrow(up ? Trend : na, title="Up Entry Arrow", colorup=lime, maxheight=60, minheight=50, transp=0)
plotarrow(down ? Trend : na, title="Down Entry Arrow", colordown=red, maxheight=60, minheight=50, transp=0)


golong = Trend == 1 and Trend[1] == -1 and MTrend == 1
goshort = Trend == -1 and Trend[1] == 1 and MTrend == -1

strategy.entry("Buy", strategy.long,when=golong)
strategy.exit("Close Buy","Buy",profit=tp,loss=sl)


strategy.entry("Sell", strategy.short,when=goshort)
strategy.exit("Close Sell","Sell",profit=tp,loss=sl)