Multi-SMA Moving Average Crossover Strategy
Author: ChaoZhang, Date: 2023-11-28 15:08:37Tags:

Overview
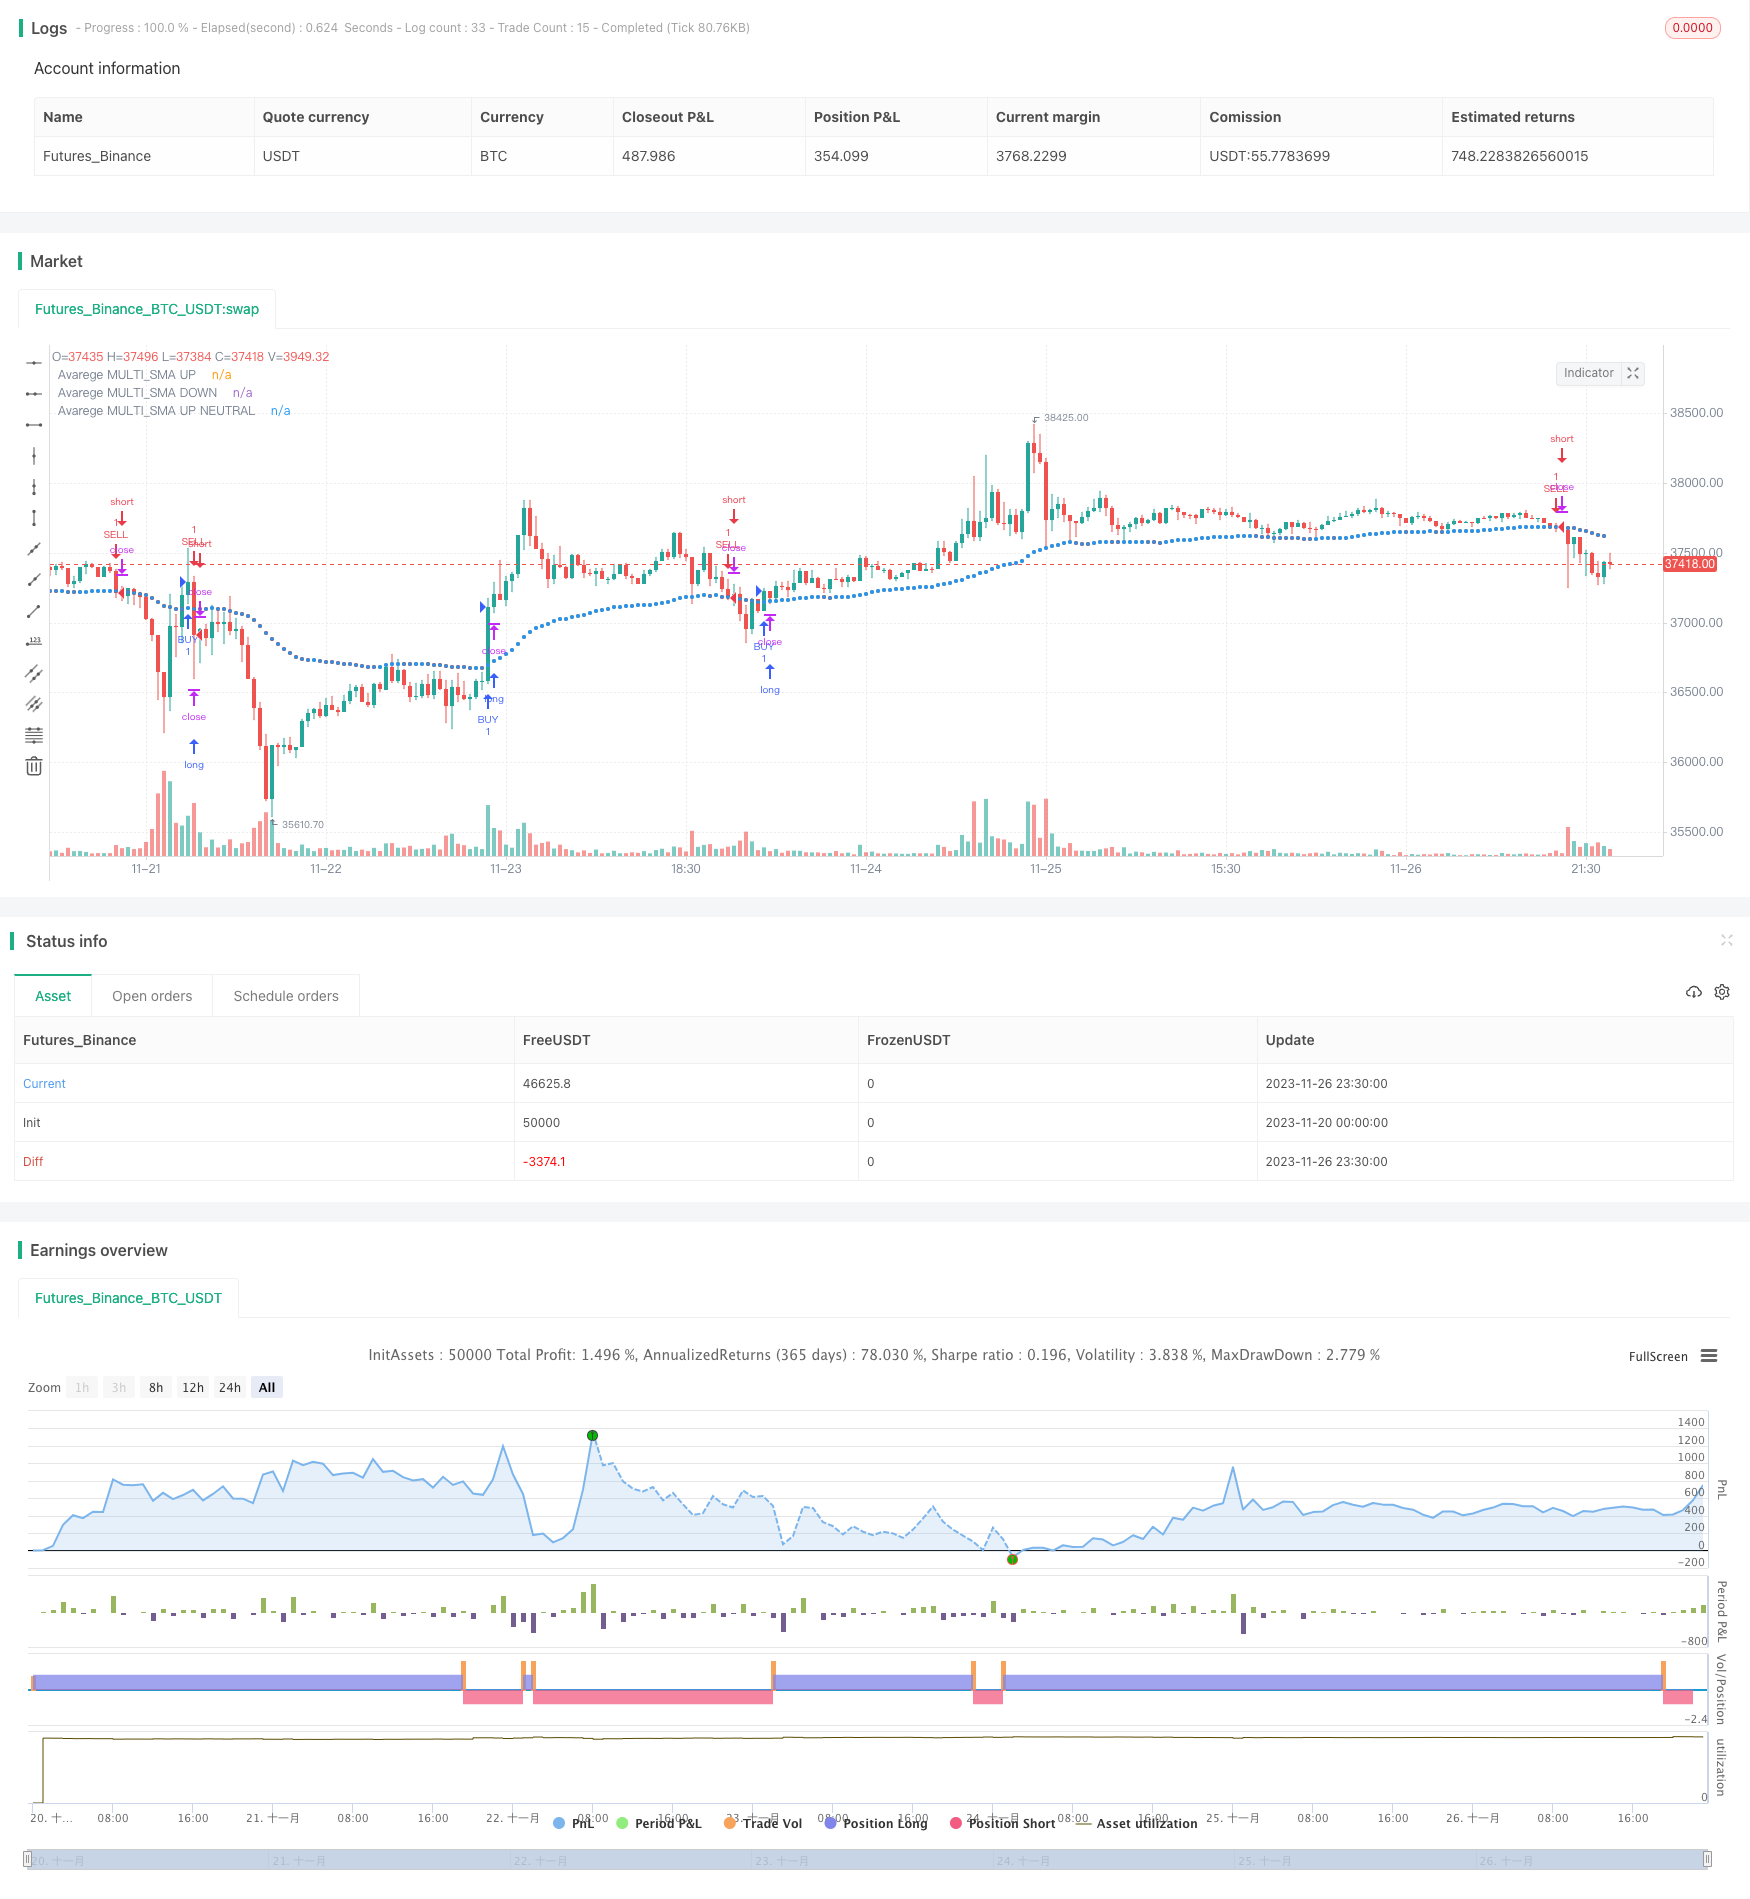
This strategy calculates the SMA moving averages of multiple timeframes and takes the average value to construct the moving average indicator. It generates buy signals when prices rise above the moving average and sell signals when prices fall below the moving average. This is a typical moving average crossover strategy.
Strategy Principle
- Calculate 5 SMA moving averages of different periods (8-day, 21-day, 50-day, 100-day, 200-day)
- Take the average of the 5 moving averages to get the final moving average indicator
- Generate buy signals when closing prices rise above the moving average
- Generate sell signals when closing prices fall below the moving average
By averaging the SMAs of multiple timeframes, this strategy can effectively smooth the curve and filter out false breakouts. Compared with a single moving average, it has higher stability.
Advantage Analysis
- Using multiple timeframe moving averages can effectively filter market noise and identify trends
- Smooth curve, avoid generating too many false signals
- The strategy logic is simple and clear, easy to understand and implement, suitable for beginners to learn
- Customizable moving average period combination to optimize indicator effect
Risk Analysis
- The moving average system lags as a whole and cannot keep up with price changes in time
- When breakout failure occurs, the stop loss point is far away, with greater risk of loss
- Stop loss lines are frequently triggered in oscillating trends
These risks can be reduced by appropriately shortening some moving average periods and adding other indicators for confirmation.
Optimization Directions
- Optimize the combinations of moving average periods to find the best parameters
- Add indicators like trading volume to confirm breakout signals
- Incorporate trend indicators to avoid false signals in oscillating markets
- Develop automatic parameter optimization programs to dynamically find the optimal parameters
Summary
The overall idea of this strategy is clear. By integrating the moving averages of multiple timeframes, it can effectively identify trends and is a stable and practical strategy. However, we also need to pay attention to its lag and false signal risks. Through further optimizing parameter settings, adding confirmation indicators, etc., we can continuously improve this strategy to make it a powerful quantitative trading tool.
/*backtest
start: 2023-11-20 00:00:00
end: 2023-11-27 00:00:00
period: 30m
basePeriod: 15m
exchanges: [{"eid":"Futures_Binance","currency":"BTC_USDT"}]
*/

//@version=3
strategy("STRATEGY AVERAGE MULTI_SMA", overlay=true)


sma1 = sma(close,input(title="SMA 1", defval=8))

sma2 = sma(close,input(title="SMA 2", defval=21))

sma3 = sma(close,input(title="SMA 3", defval=50))

sma4 = sma(close,input(title="SMA 4", defval=100))

sma5 = sma(close,input(title="SMA 5", defval=200))


mediaSMA= (sma1+sma2+sma3+sma4+sma5)/5

//color mediaSMA

MediaUP = mediaSMA>mediaSMA[1]
colorUP = (MediaUP ? #3CFF35 : na)

MediaDOWN = mediaSMA<mediaSMA[1]
colorDOWN =(MediaDOWN ? #FF0F03 : na)

colorN =(not MediaUP and not MediaDOWN and mediaSMA==mediaSMA[1] ? white : na )

plot(mediaSMA,title="Avarege MULTI_SMA UP", color=colorUP, style=circles, linewidth=2, transp=0)
plot(mediaSMA,title="Avarege MULTI_SMA DOWN", color=colorDOWN, style=circles, linewidth=2, transp=0)
plot(mediaSMA,title="Avarege MULTI_SMA UP NEUTRAL", color=colorN, style=circles, linewidth=2, transp=0)


//plot(sma1,color=blue,linewidth=1, style=line,transp=0,title="SMA 1")
//plot(sma2,color=yellow,linewidth=1, style=line,transp=0,title="SMA 2")
//plot(sma3,color=green,linewidth=1, style=line,transp=0,title="SMA 3")
//plot(sma4,color=purple,linewidth=1, style=line,transp=0,title="SMA 4")
//plot(sma5,color=red,linewidth=1, style=line,transp=0,title="SMA 5")


// Strategy

//BUY
comprar=close>mediaSMA and mediaSMA>mediaSMA[1]
fechar=close<mediaSMA and mediaSMA<mediaSMA[1]

strategy.entry("BUY",strategy.long,when=comprar)
strategy.entry("SELL",strategy.short, when=fechar)

//SELL
vender=close<mediaSMA and mediaSMA<mediaSMA[1]
fechar2=close>mediaSMA and mediaSMA>mediaSMA[1]

strategy.entry("SELL",strategy.short, when=vender)
strategy.entry("BUY", strategy.long,when=fechar2)
- Wave Trend Based Quantitative Trading Strategy
- Ichimoku Kumo Twist Gold-Absorbing Strategy
- Stepped Trailing Stop with Partial Profit Taking Strategy
- TSI and CCI Hull Moving Average Trend Tracking Strategy
- Reverse Engineering RSI Strategy
- Dual CCI Quantitative Strategy
- Dual EMA Crossover Breakout Strategy
- Multi Timeframe MACD Strategy
- Super scalping strategy based on RSI and ATR channels
- Donchian Trend Strategy
- Multi RSI Indicators Trading Strategy
- SuperTrend Strategy with Trailing Stop Loss
- Weighted Moving Average Breakout Reversal Strategy
- Moving Average Relative Strength Index Strategy
- ADX Intelligent Trend Tracking Strategy
- RSI Momentum Aggregation Strategy
- Trailing Stop Loss Strategy Based on Price Gaps
- Moving Average Breakout Strategy
- Combo Trend Reversal Moving Average Crossover Strategy
- Pivot-based RSI Divergence Strategy