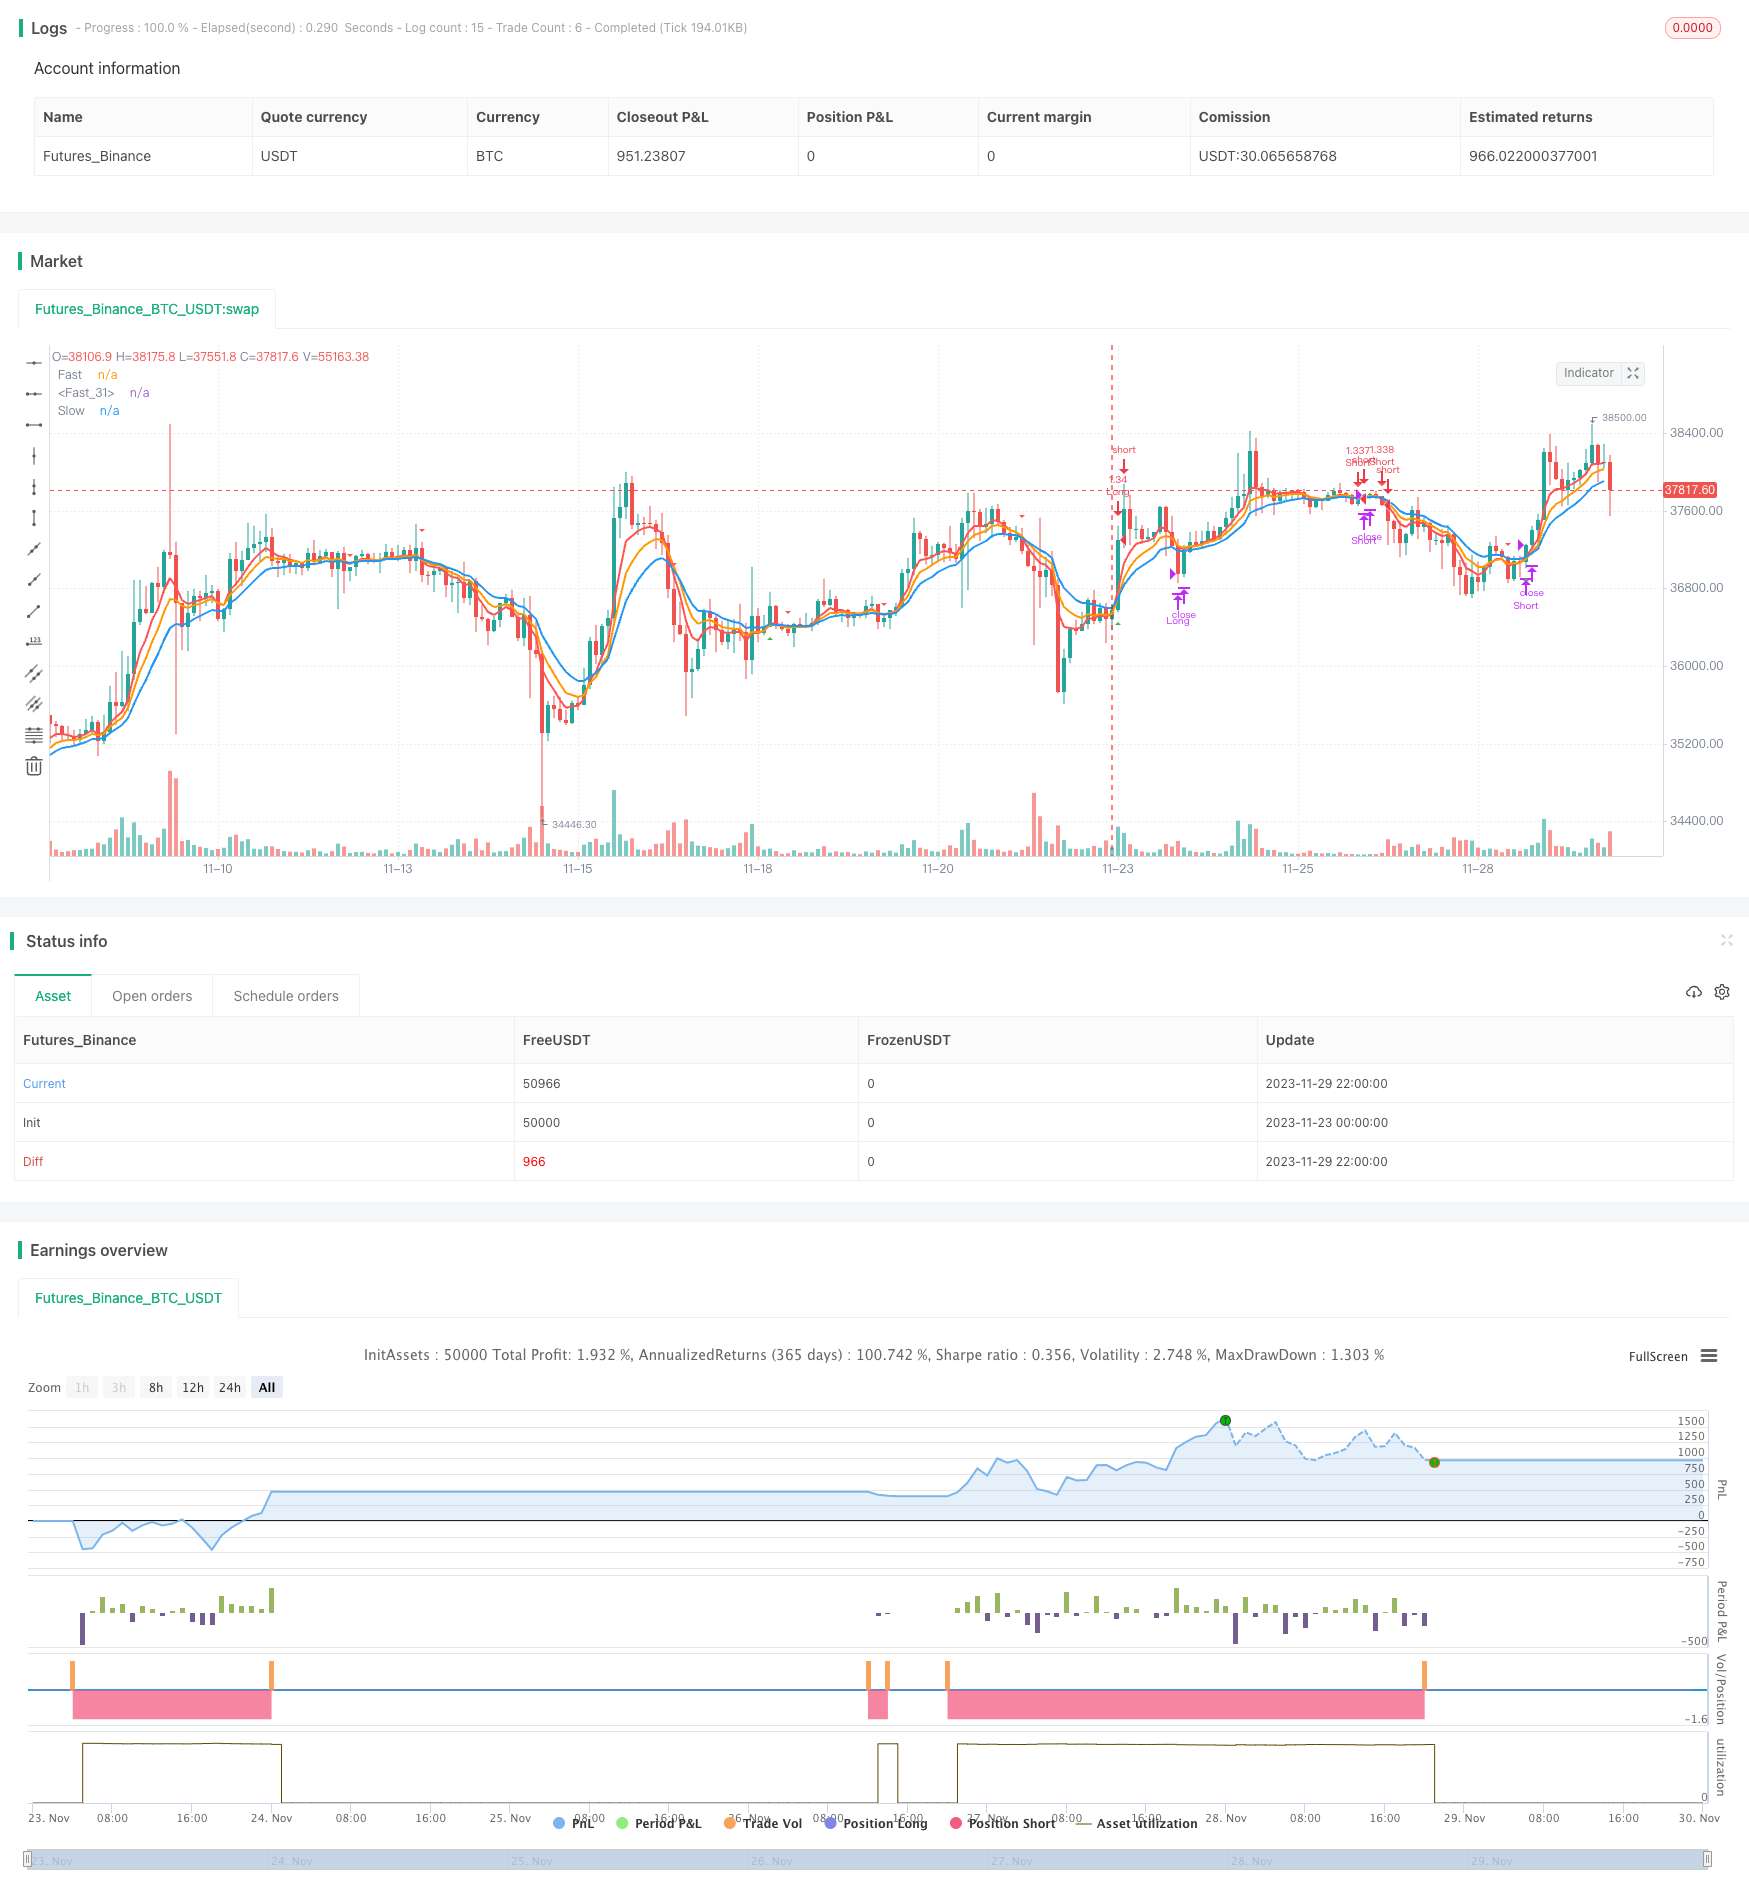
Overview
The fast and slow EMA golden cross breakthrough strategy is a simple and effective strategy to track market trends. It uses crossovers of EMAs of different cycles to generate buy and sell signals. The basic idea is: when the short cycle EMA crosses above the longer cycle EMA, a buy signal is generated; when the short cycle EMA crosses below the longer cycle EMA, a sell signal is generated.
Strategy Principle
The strategy mainly relies on the comparison of 5-cycle, 8-cycle and 13-cycle EMAs to generate trading signals. Including:
- Calculate 5-cycle EMA, 8-cycle EMA and 13-cycle EMA.
- When the 5-cycle EMA crosses above the 8-cycle and 13-cycle EMAs, a buy signal is generated.
- When the 5-cycle EMA crosses below the 8-cycle and 13-cycle EMAs, a sell signal is generated.
- At the same time, combine the ADX indicator to determine the trend strength, only when the trend is strong enough to generate signals.
This realizes the effect of tracking medium and long term trends. When the short cycle moving average crosses above the long cycle moving average, it means that the short-term trend has turned bullish and can be bought; when the short cycle moving average crosses below the long cycle moving average, it means that the short-term trend has turned bearish and should be sold.
Advantage Analysis
The main advantages of this strategy are:
- Simple operation, easy to implement.
- Make full use of the smoothing effect of EMA to effectively track trends.
- Multiple EMA combinations implement crossover to avoid false signals.
- Combined with ADX indicator, the signal is more reliable.
- Relatively low drawdown and maximum decline.
Risk Analysis
There are also some risks in this strategy:
- Stop loss may be greater when trend reverses sharply. The stop loss range can be appropriately relaxed.
- High trading frequency may increase transaction costs. EMA parameters can be adjusted appropriately to reduce trading frequency.
Optimization Direction
The strategy can be optimized in the following aspects:
- Optimize EMA parameters to find the best parameter combination.
- Add other indicators for filtering, such as KDJ, BOLL, etc., to improve signal quality.
- Adjust position management to optimize risk control.
- Use machine learning methods to find better entry and exit rules.
Summary
In summary, the operation of the fast and slow EMA golden cross breakthrough strategy is smooth, the signals are more reliable, the drawdown is not high, and it is suitable for tracking medium and long term trends. Better strategy results can be obtained through parameter optimization and improved rules.
/*backtest
start: 2023-11-23 00:00:00
end: 2023-11-30 00:00:00
period: 2h
basePeriod: 15m
exchanges: [{"eid":"Futures_Binance","currency":"BTC_USDT"}]
*/

//@version=4
//
// This source code is subject to the terms of the Mozilla Public License 2.0 at https://mozilla.org/MPL/2.0/
// © gregoirejohnb
// @It is modified by ttsaadet.
// Moving average crossover systems measure drift in the market. They are great strategies for time-limited people.
// So, why don't more people use them?
//

//
strategy(title="EMA Crossover Strategy by TTS", shorttitle="EMA-5-8-13 COS by TTS", overlay=true, pyramiding=0, default_qty_type=strategy.percent_of_equity, default_qty_value=100, currency=currency.TRY,commission_type=strategy.commission.percent,commission_value=0.04, process_orders_on_close = true, initial_capital = 100000)

// === GENERAL INPUTS ===
//strategy start date
start_year = input(defval=2020, title="Backtest Start Year")

// === LOGIC ===
short_period = input(type=input.integer,defval=5,minval=1,title="Length")
mid_period = input(type=input.integer,defval=8,minval=1,title="Length")
long_period = input(type=input.integer,defval=13,minval=1,title="Length")
rsi_period = input(type=input.integer,defval=14,minval=1,title="Length")
longOnly = input(type=input.bool,defval=false,title="Long Only")
shortEma = ema(close,short_period)
midEma = ema(close,mid_period)
longEma = ema(close,long_period)

rsi = rsi(close, rsi_period)

[diplus, diminus, adx] = dmi(short_period, short_period)
plot(shortEma,linewidth=2,color=color.red,title="Fast")
plot(midEma,linewidth=2,color=color.orange,title="Fast")
plot(longEma,linewidth=2,color=color.blue,title="Slow")

longEntry = crossover(shortEma,midEma) and crossover(shortEma,longEma) //or ((shortEma > longEma) and crossover(shortEma,midEma)))and (adx > 25)
shortEntry =((shortEma < midEma) and crossunder(shortEma,longEma)) or ((shortEma < longEma) and crossunder(shortEma,midEma))

plotshape(longEntry ? close : na,style=shape.triangleup,color=color.green,location=location.belowbar,size=size.small,title="Long Triangle")
plotshape(shortEntry and not longOnly ? close : na,style=shape.triangledown,color=color.red,location=location.abovebar,size=size.small,title="Short Triangle")
plotshape(shortEntry and longOnly ? close : na,style=shape.xcross,color=color.black,location=location.abovebar,size=size.small,title="Exit Sign")

// === STRATEGY - LONG POSITION EXECUTION ===
enterLong() =>
    longEntry and
       time > timestamp(start_year, 1, 1, 01, 01)
exitLong() =>
    crossunder(shortEma,longEma) or crossunder(close, longEma)

strategy.entry(id="Long", long=strategy.long, when=enterLong())
strategy.close(id="Long", when=exitLong())


// === STRATEGY - SHORT POSITION EXECUTION ===

enterShort() =>
    not longOnly and shortEntry and
       time > timestamp(start_year, 1, 1, 01, 01)
exitShort() =>
    crossover(shortEma,longEma)

strategy.entry(id="Short", long=strategy.short, when=enterShort())
strategy.close(id="Short", when=exitShort())