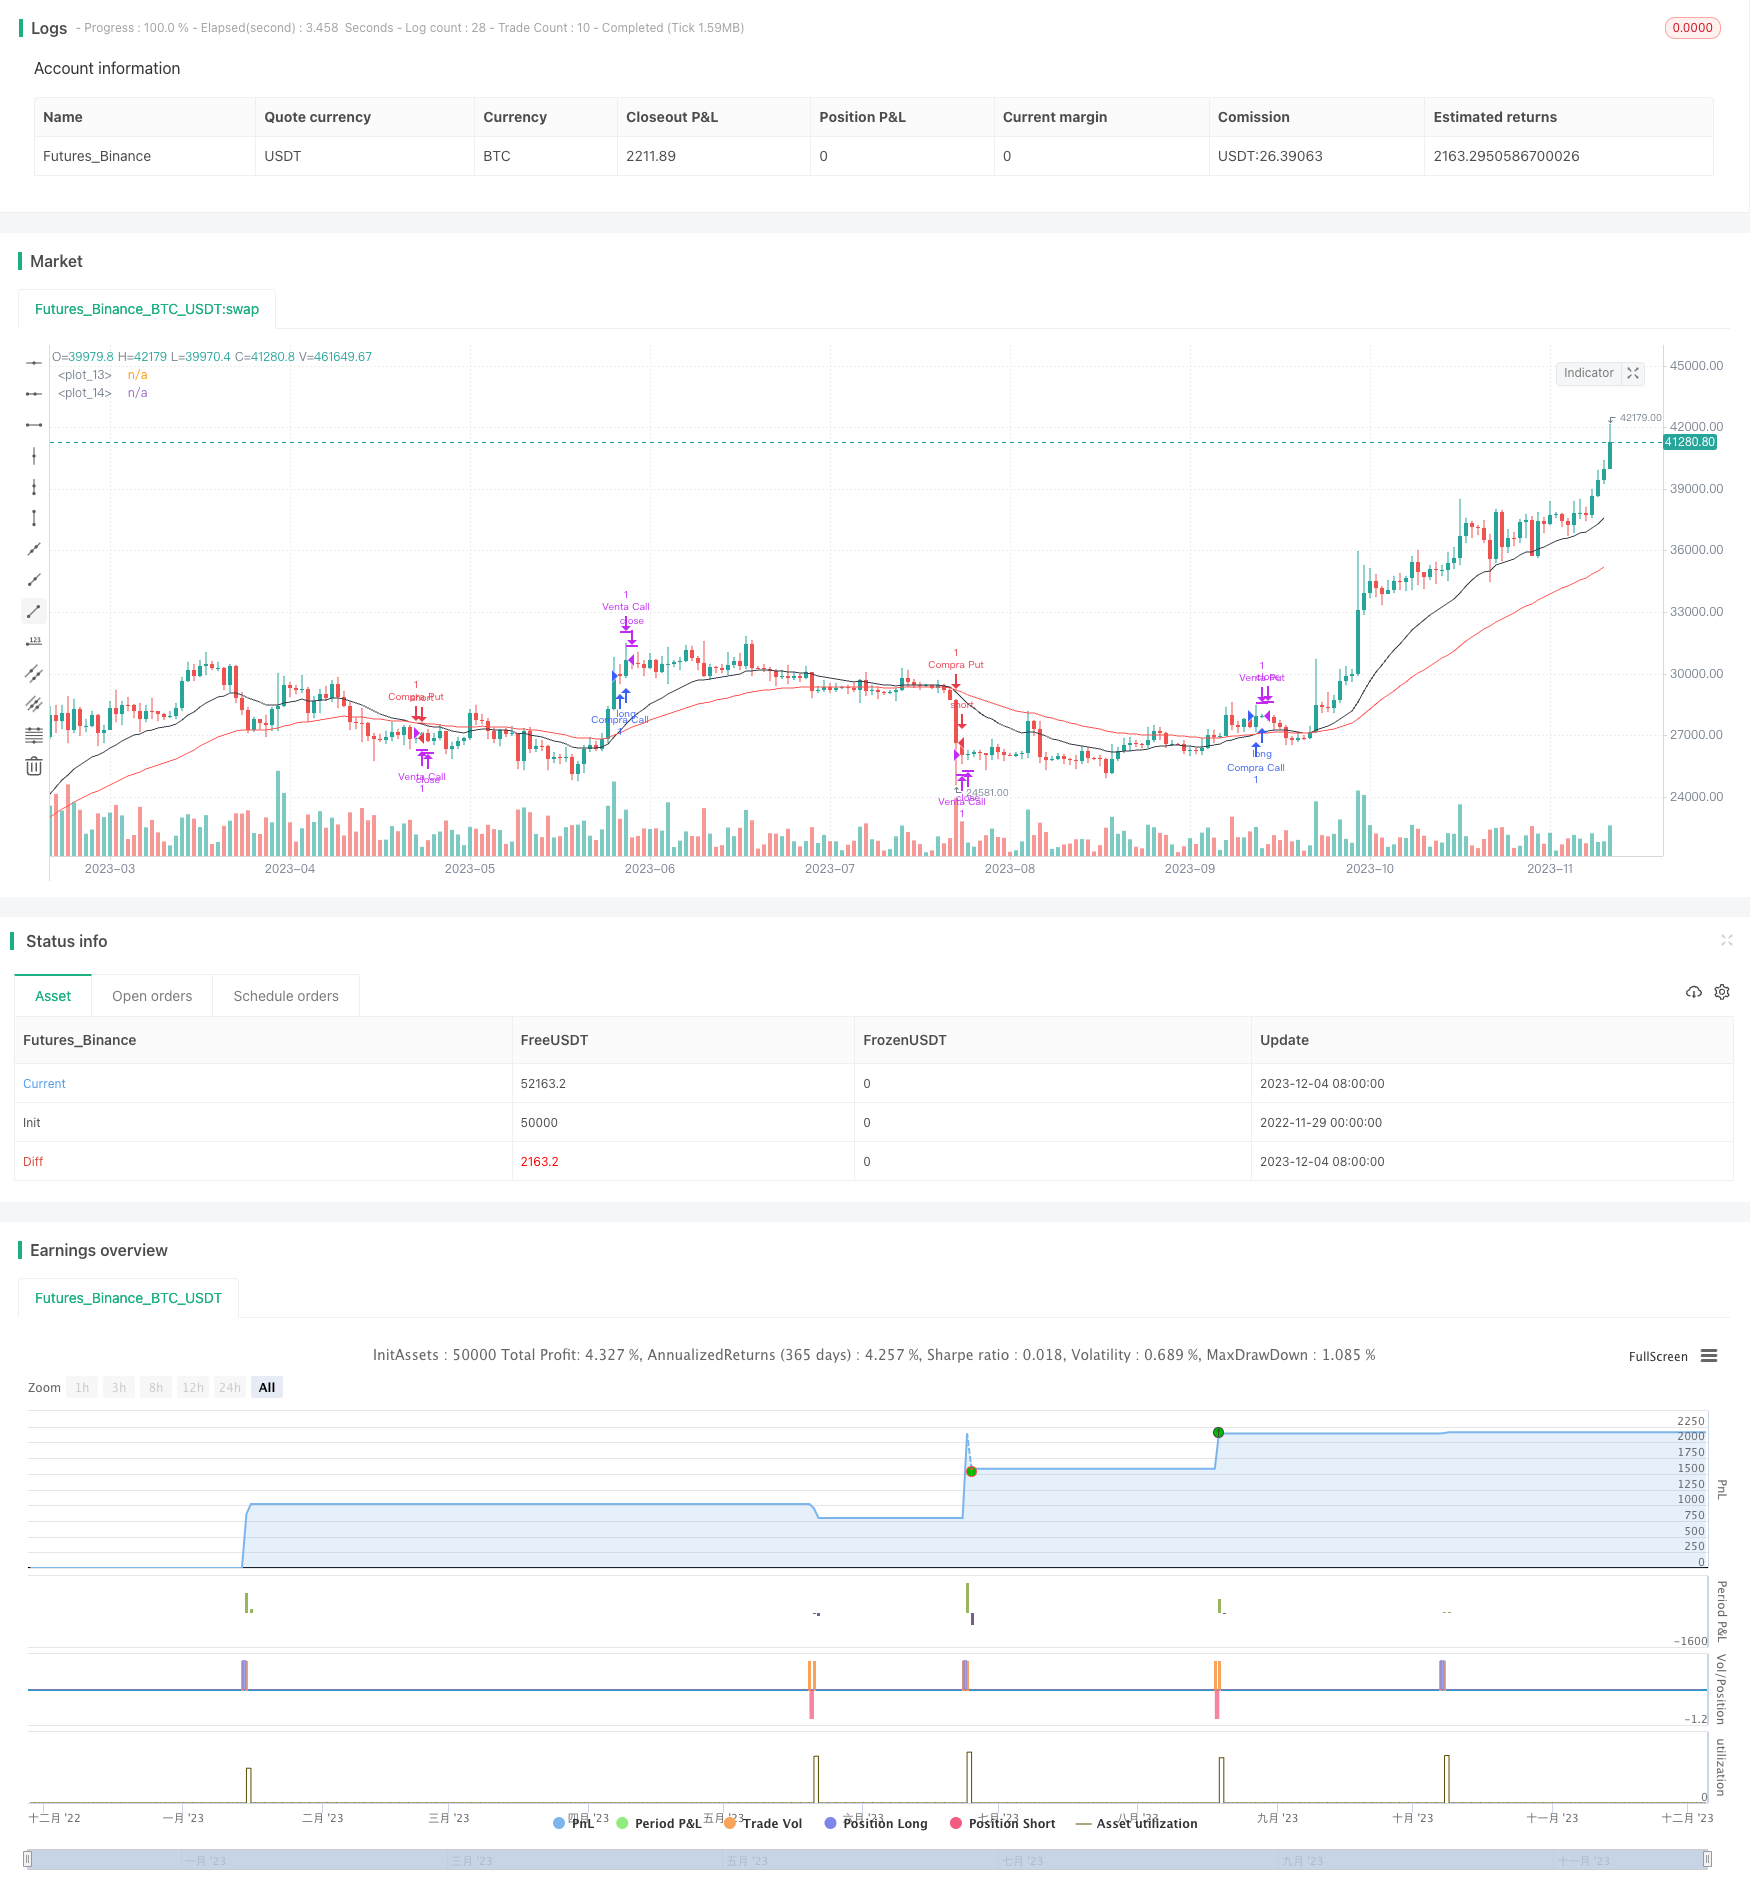
Moving Average Crossover Strategy
Author: ChaoZhang, Date: 2023-12-06 16:58:20Tags:

Overview
This is a trend following strategy based on moving average crossover. It uses two moving averages with different periods. When the shorter period moving average crosses above the longer period moving average, it goes long. When the shorter period moving average crosses below the longer period moving average, it goes short. This is a typical trend following strategy.
Strategy Logic
The strategy uses 20-period and 50-period moving averages. It first calculates these two moving averages, then identifies crossover points between them to generate trading signals. When the 20-period moving average crosses above the 50-period moving average, it generates a buy signal. When the 20-period moving average crosses below the 50-period moving average, it generates a sell signal. So the core logic of this strategy is to track the crossover between the two moving averages to determine the turning points in the market trend.
After generating trading signals, the strategy will place orders with fixed stop loss and take profit margins. For example, after buying, it will set a 0.4% stop loss and 0.7% take profit. By setting stop loss and take profit, it controls the risk and reward of individual trades.
Advantages of the Strategy
The strategy has the following advantages:
- Simple and clear operation logic, easy to understand and implement
- Reliably capture market trend turning points
- Set stop loss and take profit to well control single trade risk
Risks of the Strategy
There are also some risks with this strategy:
- More false signals when market has no clear trend
- Fail to effectively filter market noise, prone to being trapped
- The stop loss and take profit margins may not suitable for all products, need optimization
Countermeasures:
- Optimize moving average periods to filter false signals
- Add other indicators for filtration
- Test and optimize stop loss and take profit parameters
Optimization Directions
The strategy can be optimized in the following aspects:
- Optimize moving average periods to find best parameter combination
- Add indicators like trading volume to filter signals
- Test and optimize stop loss and take profit margins on specific products
- Change fixed stop loss and take profit to dynamic ones
- Add machine learning algorithms to automatically find optimum parameters
Summary
Overall this is a simple and effective trend following strategy. It catches trend turning points using moving average crossover and controls risk via stop loss and take profit. The strategy suits investors who don’t have high requirements on trend judgment. Further optimization on parameters and models can lead to better strategy performance.
]
/*backtest
start: 2022-11-29 00:00:00
end: 2023-12-05 00:00:00
period: 1d
basePeriod: 1h
exchanges: [{"eid":"Futures_Binance","currency":"BTC_USDT"}]
*/

// This source code is subject to the terms of the Mozilla Public License 2.0 at https://mozilla.org/MPL/2.0/
// © danielfepardo

//@version=5

strategy("QUANT", overlay=true)
lenght1 = input(20)
lenght2 = input(50)


ema1 = ta.ema(close, lenght1)
ema2 = ta.ema(close, lenght2)
plot(ema1, color=color.black)
plot(ema2, color=color.red)

long = ta.crossover(ema1, ema2)

SL = 0.004
TP = 0.007

if long == true
    strategy.entry("Compra Call", strategy.long)
longstop=strategy.position_avg_price*(1-SL)
longprofit=strategy.position_avg_price*(1+TP)
strategy.exit("Venta Call", stop=longstop, limit=longprofit)

short = ta.crossover(ema2, ema1)

if short == true
    strategy.entry("Compra Put", strategy.short)
shortstop=strategy.position_avg_price*(1+SL)
shortprofit=strategy.position_avg_price*(1-TP)
strategy.exit("Venta Put", stop=shortstop, limit=shortprofit)
- Dual Indicator Filtered Buy Signal Strategy
- Dual Moving Average Crossover Trading Strategy
- Dual EMA Crossover Strategy
- Momentum Breakout Camarilla Support Strategy
- Honey Trend ATR Breakout Strategy
- Trend Following Strategy with EMA
- Double Reversal Percentage Change Bar Quantitative Strategy
- Bollinger Bands Reversal with MA Trend Filter
- RSI Based Quantitative Trading Strategy
- Multi Moving Average Crossover Trading Strategy
- Auto S/R Breakout Strategy
- Momentum Price Channel Opening and Closing Strategy
- Improved Moving Average Crossover Strategy with Market Trend Guidance
- Dynamic Candlestick Big Yang Line Trading Strategy
- SSL Hybrid Exit Arrow Quant Strategy
- Dual Moving Average ADX Timing Strategy
- BB Percentage Index Trend Fading Strategy
- MACD Bollinger Turtle Trading Strategy
- Triple SuperTrend and Stoch RSI Strategy
- 1% Profit Moving Average Cross Strategy