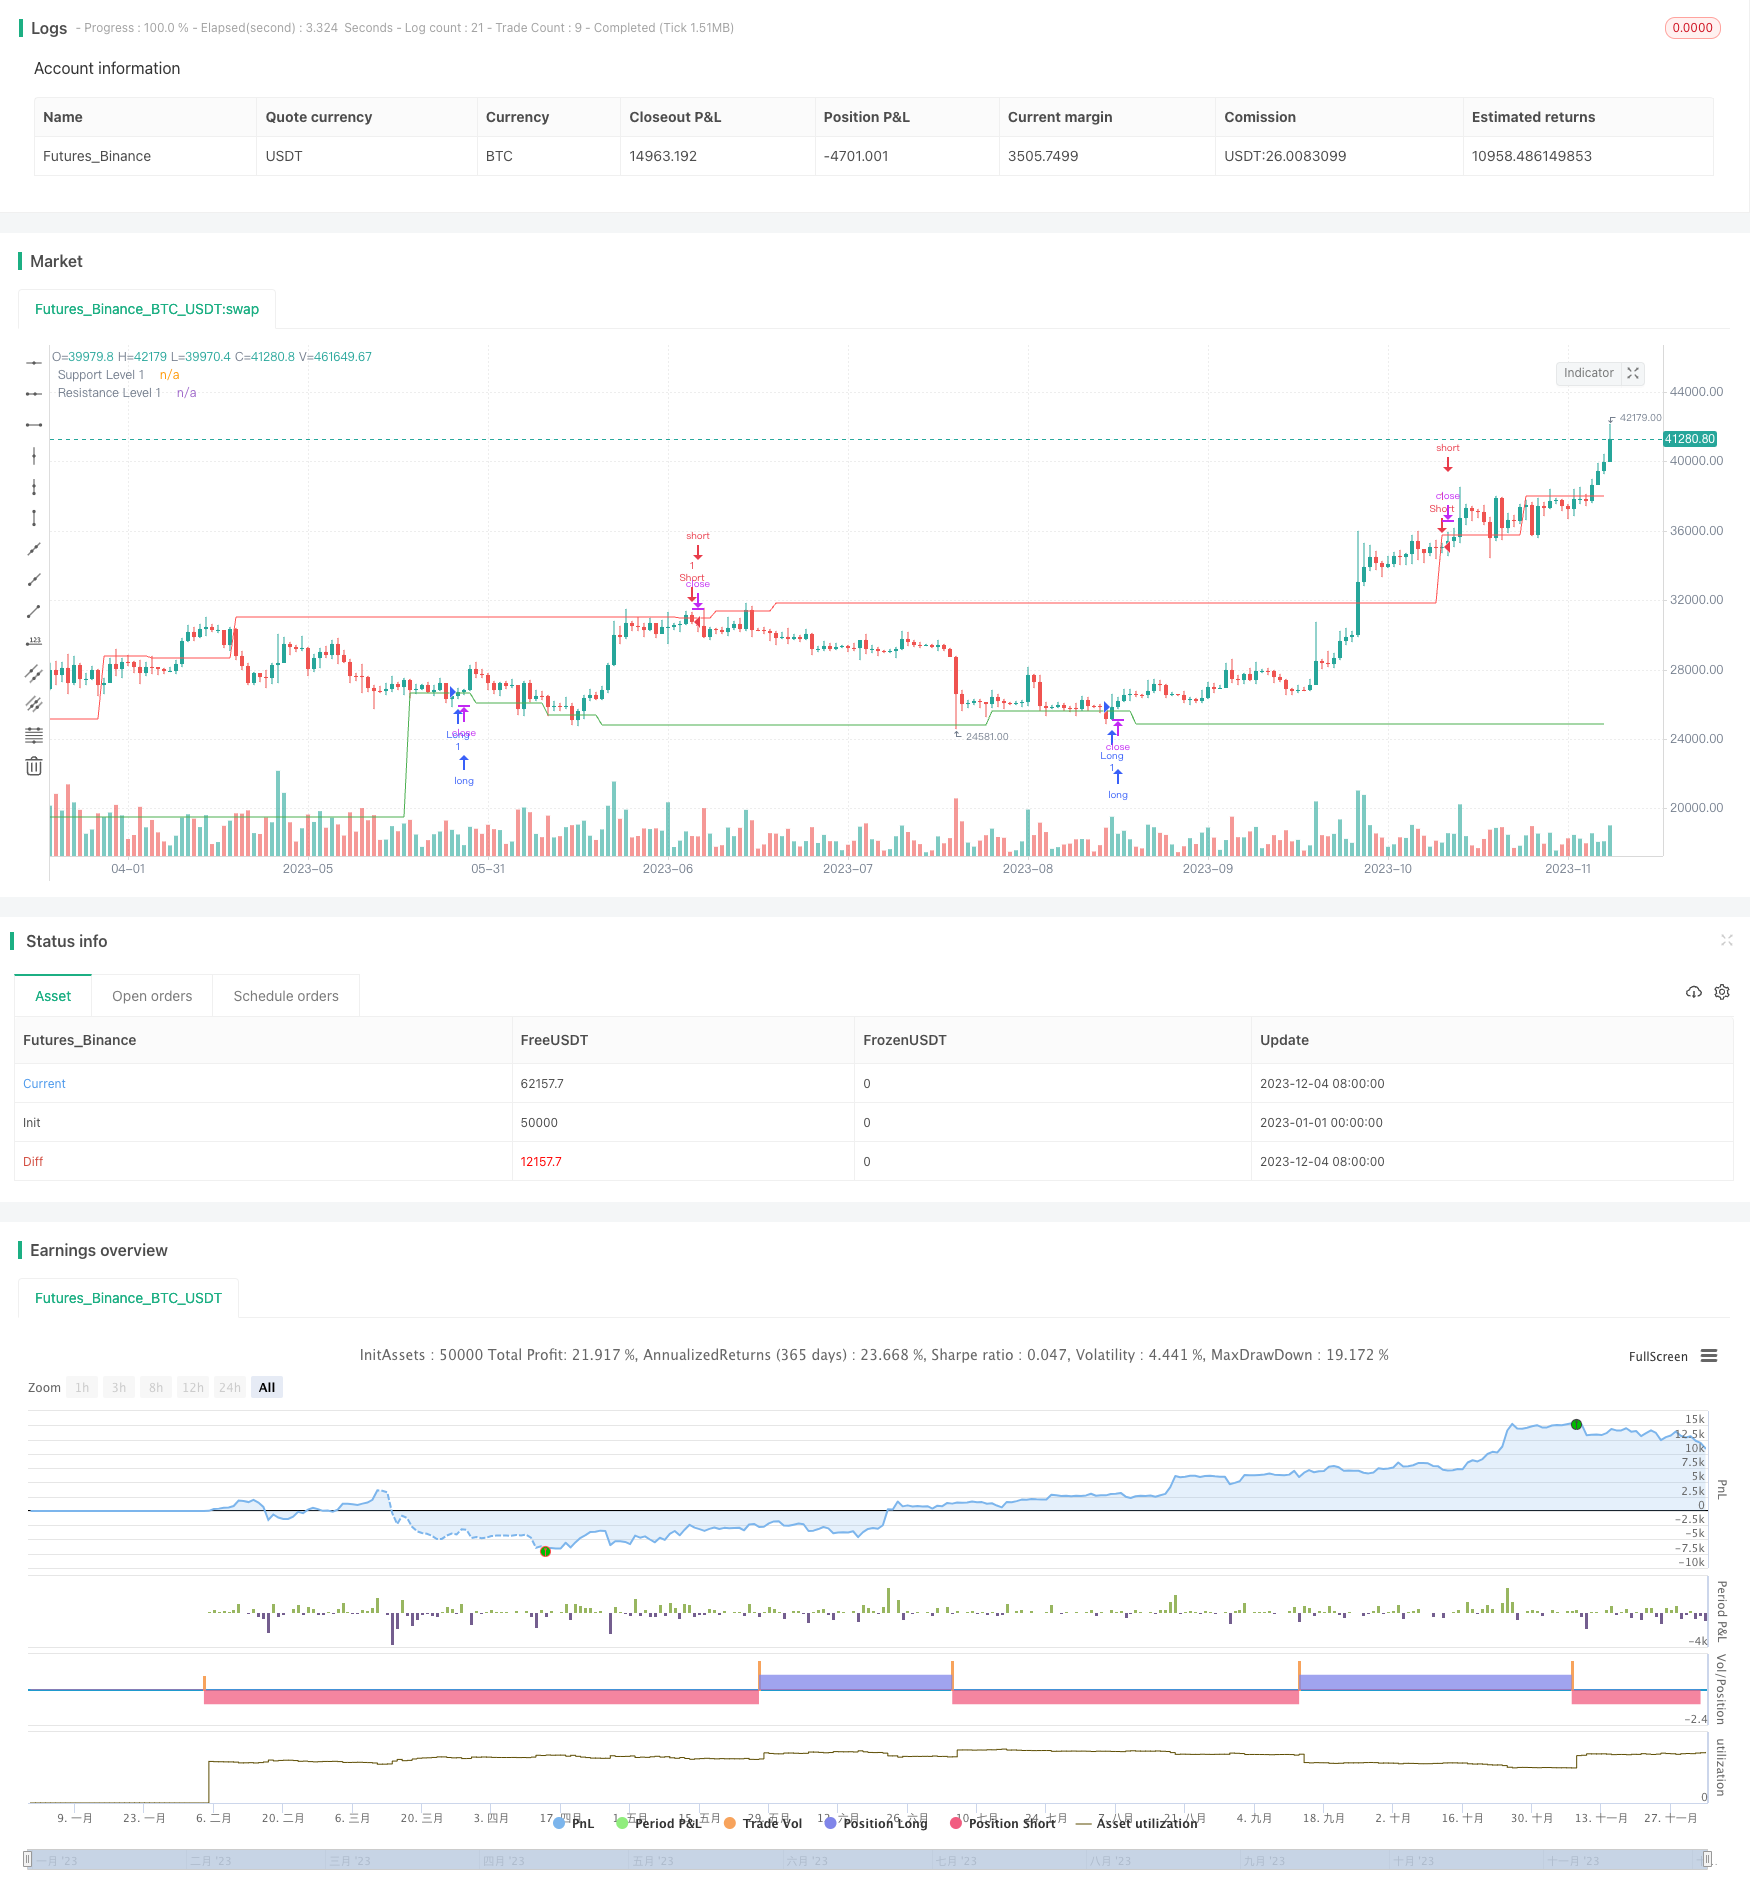
概述
自动支撑/阻力策略是一种趋势跟踪策略。它通过计算一定周期内的最高价和最低价,来确定关键的支撑和阻力位。当价格突破这些关键位时,进行买入或者卖出操作。
策略原理
该策略首先计算左侧和右侧某个周期数内的最高价和最低价,确定主要的支撑和阻力位。然后再在更短周期内计算最高价和最低价,确定快速的支撑和阻力位。当价格突破快速支撑位时,进行买入操作;当价格突破快速阻力位时,进行卖出操作。
策略的关键逻辑是,左右两侧价格形成支撑或阻力后,如果价格突破这些位,那么很可能开始新的趋势,这时进行操作可以捕捉趋势的方向。该策略同时结合不同周期判断趋势,从而避免被短期动量影响判断。
优势分析
该策略最大的优势在于,可以自动确定关键的支撑和阻力位。不需要人工判断支撑和阻力的位置。同时结合不同周期判断趋势,可以有效过滤假突破的情况,避免交易被套。
另外,策略买入条件和卖出条件都简单清晰,只需要价格突破快速支撑或阻力位即可。容易实施,也容易回测优化参数。
风险分析
该策略最大的风险在于,自动计算的支撑和阻力位不一定可靠,价格可能直接突破这些位形成新的趋势。这时会造成损失。
另外,如果快速支撑和阻力位设置的周期太短,可能导致产生过多假突破信号。从而增大实际交易的亏损。
为降低风险,可以考虑结合其他指标进行过滤,例如成交量、移动平均线等指标的方向判断。或者人工检查自动计算的支撑和阻力位的合理性。
优化方向
该策略主要可以从两方面进行优化:
优化键入的周期参数,寻找最佳参数组合。可以尝试不同左右周期的组合,找到突破成功率最高的参数。
增加指标过滤条件,例如量能指标、移动平均线等,避免假突破。也可以结合人工判断关键位的方式,提升策略效果。
总结
本策略整体是一个较好的自动判断支撑和阻力位的策略框架。由于自动判断支撑阻力位,实施难度不高,适合用于捕捉趋势的方向。同时结合参数优化和条件过滤,可以进一步提升策略收益。
/*backtest
start: 2023-01-01 00:00:00
end: 2023-12-05 00:00:00
period: 1d
basePeriod: 1h
exchanges: [{"eid":"Futures_Binance","currency":"BTC_USDT"}]
*/

// This source code is subject to the terms of the Mozilla Public License 2.0 at https://mozilla.org/MPL/2.0/
// © lukaRT

//@version=5
strategy("Auto S/R Strategy", shorttitle="Auto S/R", overlay=true)

// Ваши входные параметры
leftBars = input.int(50, title="Left Bars")
rightBars = input.int(25, title="Right Bars")
quickRightBars = input.int(5, title="Quick Right Bars")
src = input(close, title="Source")

pivotHigh = ta.pivothigh(src, leftBars, rightBars)
pivotLow = ta.pivotlow(src, leftBars, rightBars)

quickPivotHigh = ta.pivothigh(src, leftBars, quickRightBars)
quickPivotLow = ta.pivotlow(src, leftBars, quickRightBars)

// Ваши уровни сопротивления и поддержки
resistanceLevel1 = ta.valuewhen(quickPivotHigh, high[quickRightBars], 0)
supportLevel1 = ta.valuewhen(quickPivotLow, low[quickRightBars], 0)

// Пересечение ценой уровней
longCondition = ta.crossover(close, supportLevel1)
shortCondition = ta.crossunder(close, resistanceLevel1)

strategy.entry("Long", strategy.long, when=longCondition)
strategy.entry("Short", strategy.short, when=shortCondition)

// Отображение линий сопротивления и поддержки на графике
plot(resistanceLevel1, color=color.red, title="Resistance Level 1")
plot(supportLevel1, color=color.green, title="Support Level 1")