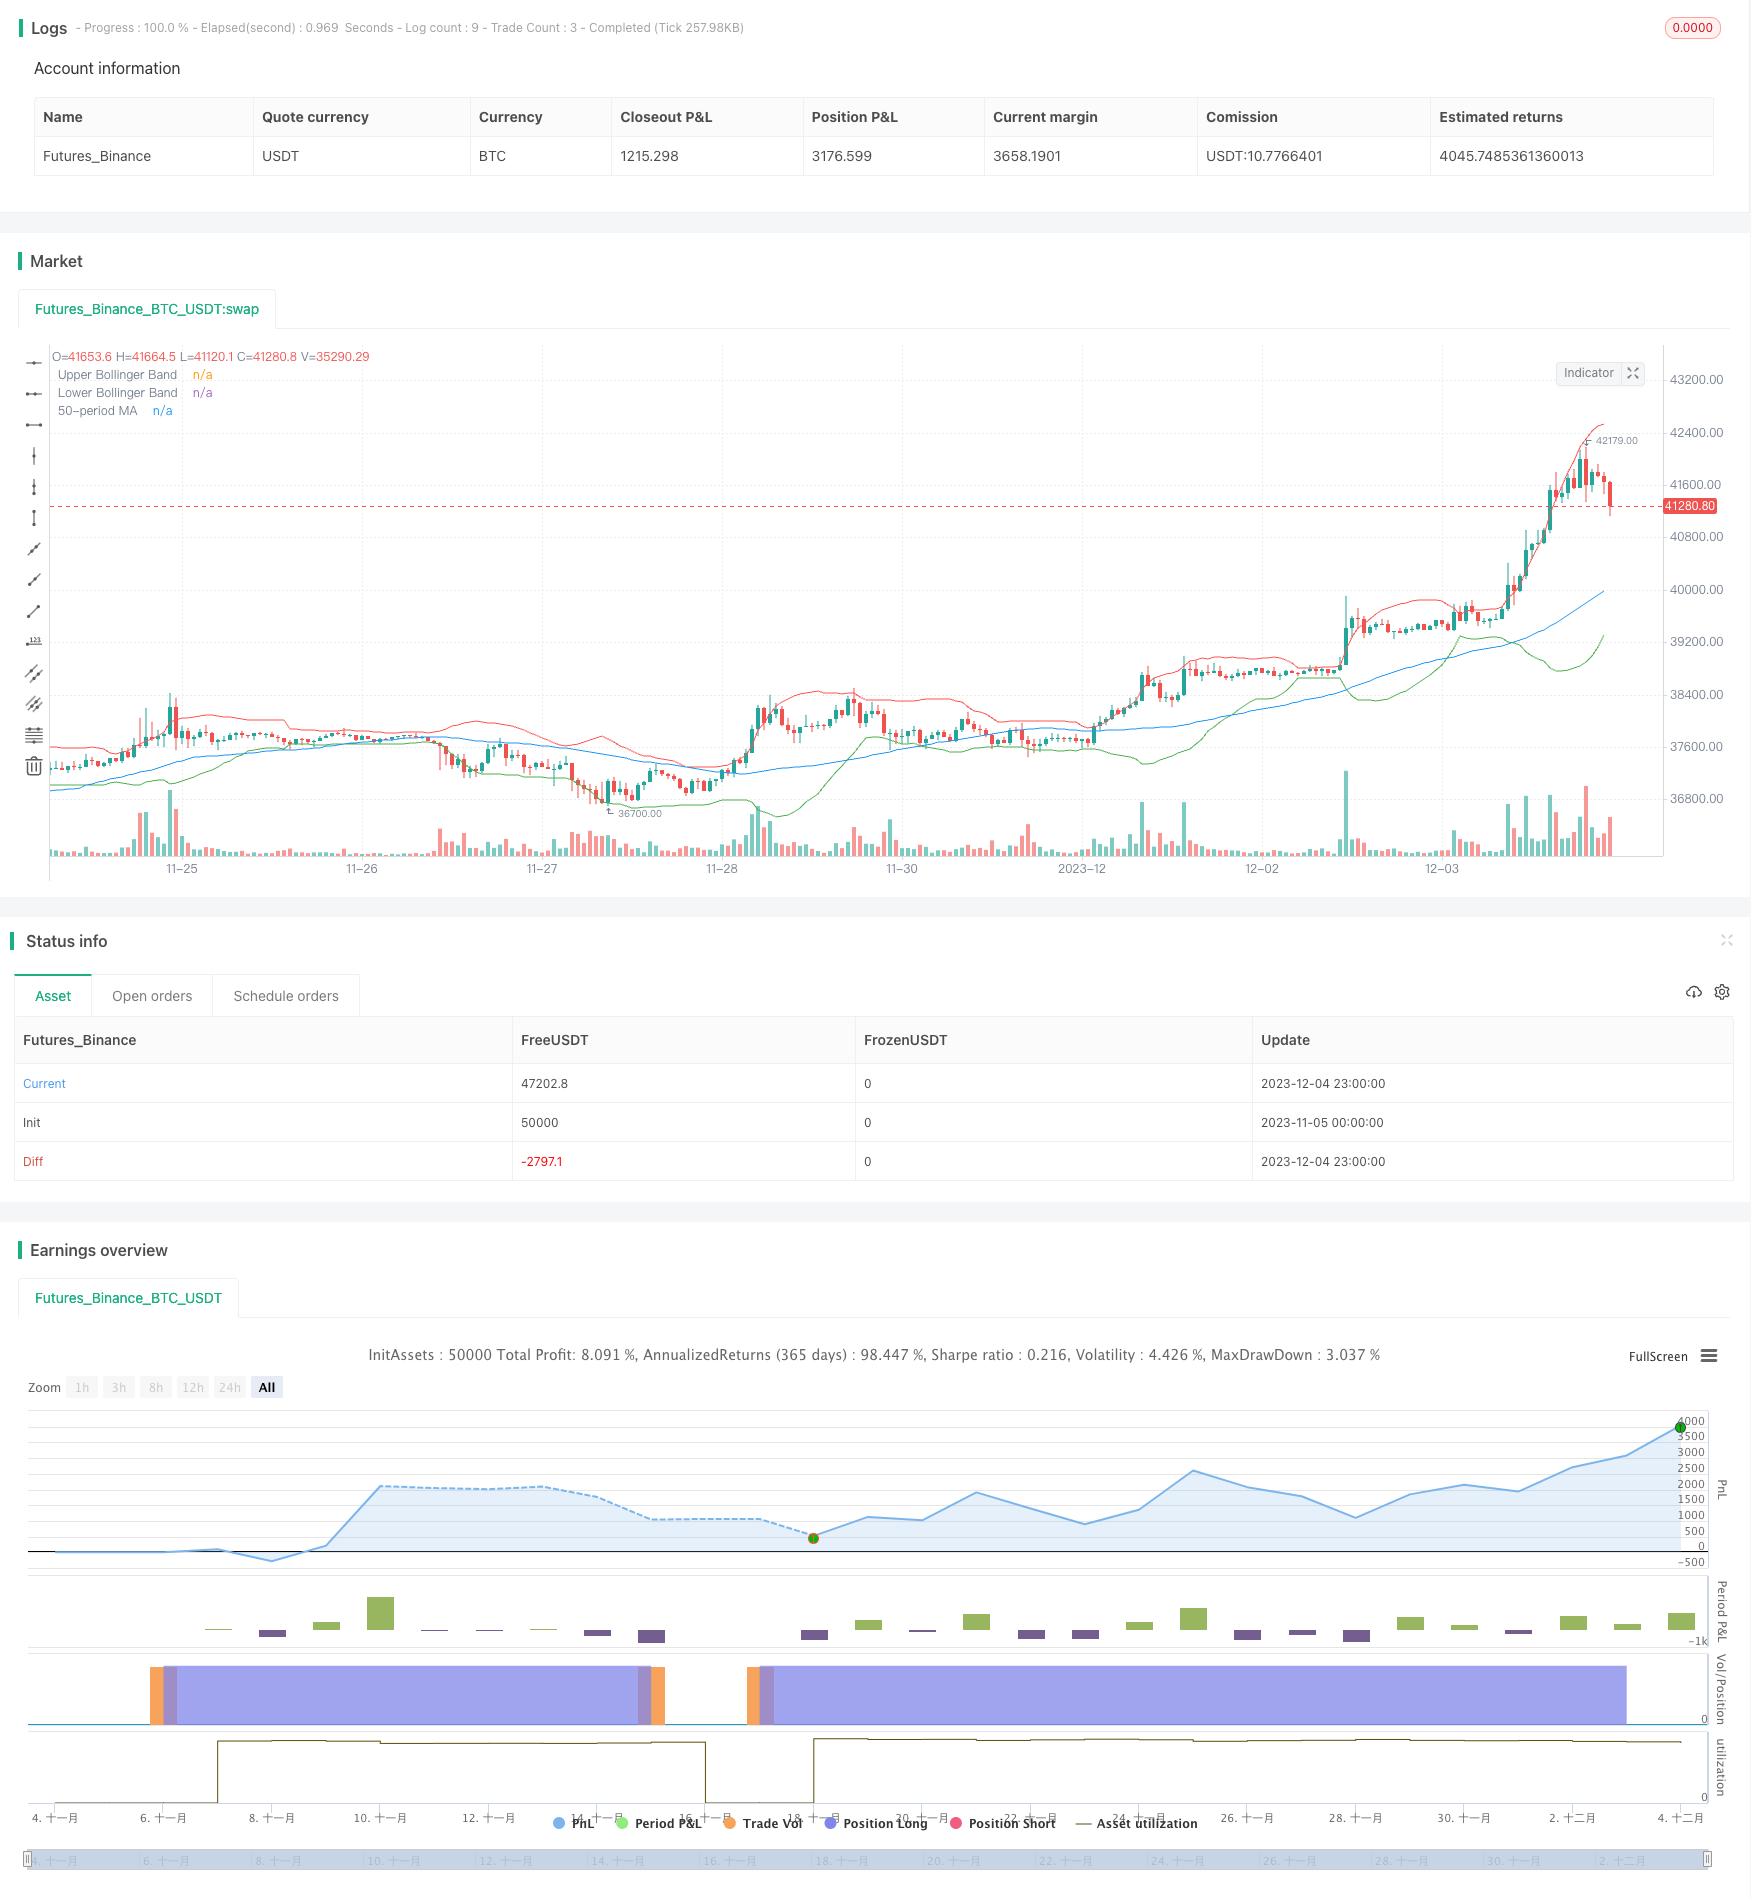
Overview
This strategy combines Bollinger Bands and Moving Average, using the reversal points of Bollinger Bands’ upper and lower rails and the direction of Moving Average as entry and exit signals. Specifically, when the price breaks through the lower rail of Bollinger Bands upwards and is higher than Moving Average, go long; when the price breaks through the upper rail of Bollinger Bands downwards and is lower than Moving Average, close position.
Strategy Principle
This strategy is mainly based on two indicators: Bollinger Bands and Moving Average.
Bollinger Bands contain upper band, lower band and middle rail. The middle rail is the n-day simple moving average, and the upper and lower bands are k times standard deviation up and down from the middle rail. When the price approaches the upper or lower band, it indicates overbuying or overselling, which may result in a reversal.
Moving average reflects the average trend direction of prices. When the short-term moving average crosses above the long-term moving average, it indicates the price trend is upgoing, so going long can be considered; when the short-term moving average crosses below the long-term moving average, it indicates the price trend is downgoing, so going short can be considered.
This strategy takes into account both the reversal signals from Bollinger Bands and the trend judgment from Moving Average. It generates buy signals when prices break through the lower band of Bollinger Bands, and also requires the Moving Average to go upwards to ensure an upward major trend; it generates sell signals when prices break through the upper band of Bollinger Bands, and also requires the Moving Average to go downwards to ensure a downward major trend. Thus it realizes considering major trend directions while capturing reversals.
The specific operation rules are:
- When price breaks through the lower band of Bollinger Bands upwards and is higher than Moving Average, go long.
- When price breaks through the upper band of Bollinger Bands downwards and is lower than Moving Average, close position.
Advantage Analysis
The main advantages of this strategy include:
- Taking both medium-term reversal signals and long-term trend directions into consideration, meeting the needs for dual-directional operations.
- Utilizing the strong reversal nature of Bollinger Bands’ upper and lower rails to obtain better entry opportunities.
- Adding Moving Average filter to avoid whipsaws in sideways markets.
- The strategy logic is simple and clear, easy to understand and implement, suitable for quantitative trading.
Risks and Solutions
The main risks of this strategy include:
- Improper parameter settings for Bollinger Bands may result in too frequent trading signals from upper and lower bands breakouts, causing whipsaws easily. Parameters can be optimized to find the best combination.
- Improper parameter settings for Moving Average may filter some good trading opportunities. Other indicators can be considered to combine with for optimization.
- Markets may have long sideways consolidations, enlarging losses. Stop loss points can be set to limit individual losses within certain range.
Strategy Optimization
The main aspects this strategy can optimize on:
- Optimize parameters for Bollinger Bands to find the optimal parameter combination for producing trading signals.
- Try different types and lengths of parameters for Moving Average to find the best match.
- Add judgments from other indicators such as volume, RSI etc. to improve strategy performance.
- Build dynamic stop loss mechanisms that set stop loss points according to market volatility ranges.
- Test parameter settings on different products to find optimal adaptability.
Summary
This strategy takes both the reversal signals from Bollinger Bands and trend judgments from Moving Average into consideration, controlling the impact of local shocks on overall trend judgments while ensuring reversal effectiveness. The signals and principles are simple and clear, easy to understand and implement, and there are multiple ways to optimize for better performance, making it an efficient strategy suitable for quantitative trading.
/*backtest
start: 2023-11-05 00:00:00
end: 2023-12-05 00:00:00
period: 1h
basePeriod: 15m
exchanges: [{"eid":"Futures_Binance","currency":"BTC_USDT"}]
*/

//@version=5
strategy("Bollinger Bands Rejection with MA Trend Filter", overlay=true)

// Bollinger Bands Settings
length = input(20, title="Bollinger Bands Length")
src = input(close, title="Source")
mult = input(2.0, title="Standard Deviation")
basis = ta.sma(src, length)
dev = mult * ta.stdev(src, length)

// Calculate Bollinger Bands
upper_band = basis + dev
lower_band = basis - dev

// MA Settings
ma_length = input(50, title="MA Length")
ma_src = input(close, title="MA Source")
ma = ta.sma(ma_src, ma_length)

// Buy Condition
buy_condition = ta.crossover(close, lower_band) and ta.crossover(close, ma)

// Sell Condition
sell_condition = ta.crossunder(close, upper_band) and ta.crossunder(close, ma)

if buy_condition
    strategy.entry("Buy", strategy.long)

if sell_condition
    strategy.close("Buy")

plot(upper_band, color=color.red, title="Upper Bollinger Band")
plot(lower_band, color=color.green, title="Lower Bollinger Band")
plot(ma, color=color.blue, title="50-period MA")