Quantitative Trading Strategy Based on Random Numbers
Author: ChaoZhang, Date: 2023-12-07 17:14:20Tags:

Overview
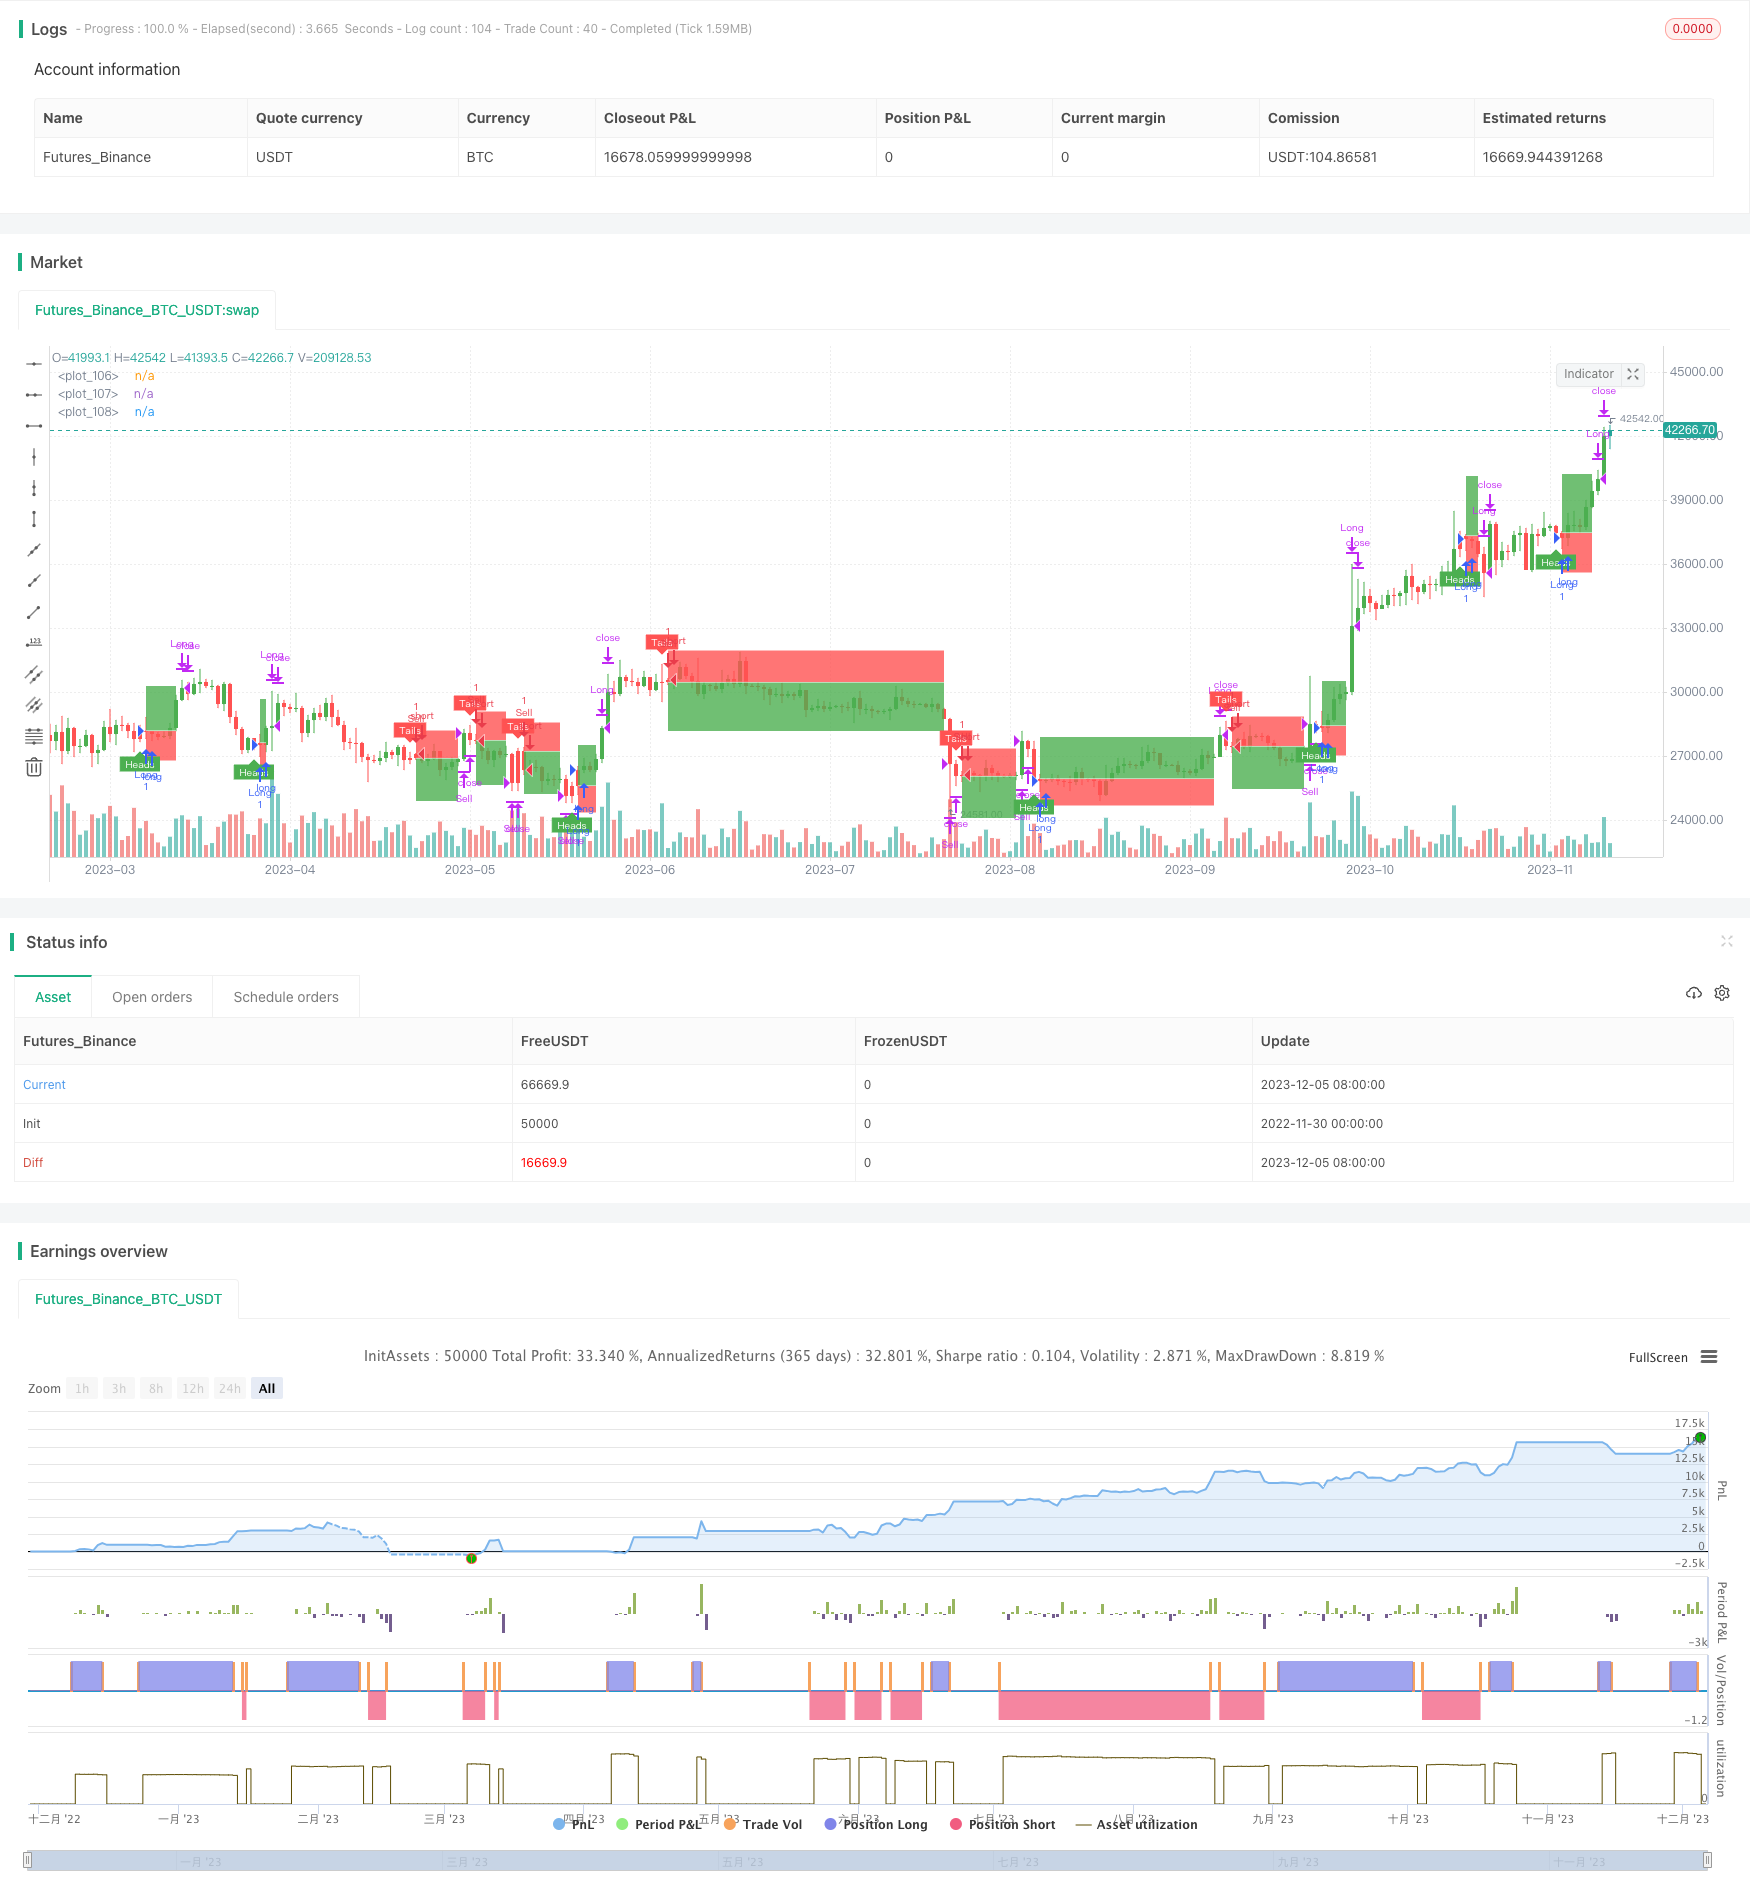
The core idea of this strategy is to simulate probability events such as coin flipping and dice rolling using random numbers to determine long or short positions, thus implementing random trading. This kind of trading strategy can be used for simulation testing and also as a basic framework for more complex strategy development.
Strategy Principle
-
Use the
flipvariable to simulate random events and determine long or short based on thecoinLabelrandom number size. -
Use
riskandratioto set stop loss and take profit lines. -
Trigger the next trading signal randomly according to the set maximum cycle number.
-
Control whether to display the close position box through the
plotBoxvariable. -
stoppedOutandtakeProfitvariables are used to detect stop loss or take profit. -
Provide backtesting capabilities to test strategy performance.
Advantage Analysis
-
The code structure is clear and easy to understand and secondary develop.
-
The UI interaction is friendly and various parameters can be adjusted through the graphical interface.
-
The randomness is strong and not affected by market fluctuations, with high reliability.
-
Better return on investment can be obtained through parameter optimization.
-
Can be used as a demonstration or test for other strategies.
Risk Analysis
-
Random trading cannot judge the market and there is a certain profit risk.
-
Unable to determine the optimal parameter combination, repeated testing is required.
-
There is a risk of super correlation that may result from overly dense random signals.
-
It is recommended to use stop loss and take profit mechanisms to control risks.
-
Risks can be reduced by appropriately extending the trading interval.
Optimization Directions
-
Incorporate more complex factors to generate random signals.
-
Increase trading varieties to expand test scope.
-
Optimize UI interaction and increase strategy control capabilities.
-
Provide more test tools and indicators for parameter optimization.
-
Can be used as a trading signal or stop loss take profit component added to other strategies.
Summary
The overall framework of this strategy is complete, generating trading signals based on random events, with high reliability. At the same time, it provides parameter adjustment, backtesting, and charting capabilities. It can be used to test novice strategy development, and also as a basic module for other strategies. Through appropriate optimization, the strategy performance can be further improved.
/*backtest
start: 2022-11-30 00:00:00
end: 2023-12-06 00:00:00
period: 1d
basePeriod: 1h
exchanges: [{"eid":"Futures_Binance","currency":"BTC_USDT"}]
*/

// This source code is subject to the terms of the Mozilla Public License 2.0 at https://mozilla.org/MPL/2.0/
// © melodicfish

//@version=4
strategy("Coin Flipper Pro",overlay=true,max_bars_back=100)

// ======= User Inputs variables=========

h1=input(title="------- Trade Activity -------",defval=false)
maxBars=input(25.0,title="Max Bars between Coin Filps",step=1.0,minval=4.0)

h2=input(title="------- Position Settings -------",defval=false)
risk=input(defval=5.0,title="Risk in % ",type=input.float, minval=0.001 ,step=0.1)
ratio= input(defval=1.5,title="Risk to Reward Ratio x:1 ",type=input.float, minval=0.001,step=0.1)

h3=input(title="------- Plot Options -------",defval=false)
showBox=input(defval=true, title="Show Position Boxes")

h4=input(title="------- Back Testing -------",defval=false)
runTest=input(defval=true, title="Run Strategy Back Test")
customTime=input(defval=false, title="Use Custom Date Range for back test")


tsYear = input(2021,minval=1000,maxval=9999,title= "Test Start Year")
tsMonth = input(1,minval=1,maxval=12,title= "Test Start Month")
tsDay = input(1,minval=1,maxval=31,title= "Test Start Day")
start = timestamp(tsYear,tsMonth,tsDay,0,0)

teYear = input(2021,minval=1000,maxval=9999,title=  "Test Stop Year")
teMonth = input(5,minval=1,maxval=12,title=  "Test Stop Month")
teDay = input(1,minval=1,maxval=31,title=  "Test Stop Day")
end = timestamp(teYear,teMonth,teDay,0,0)

// ======= variables =========
var barsBetweenflips=25
var coinFlipResult=0.0
var flip=true
var coinLabel=0.0
var stoppedOut= true
var takeProfit=true
var posLive=false
var p1=0.0
var p2=0.0
var p3=0.0
var plotBox=false
var posType=0
long=false
short=false


// ===== Functions ======

getColor() =>
    round(random(1,255))


// ===== Logic ========
if barssince(flip==true)>barsBetweenflips and posLive==false
    flip:=true
    coinLabel:=random(1,10)

    // Candle Colors
candleColor= flip==true and flip[1]==false and barstate.isconfirmed==false?color.rgb(getColor(),getColor(),getColor(),0):flip==false and close>=open?color.green:color.red
candleColor:= barstate.ishistory==true and close>=open?color.green: barstate.ishistory==true and close<open? color.red:candleColor
barcolor(candleColor)

if flip[1]==true and posLive==false
    flip:=false
    barsBetweenflips:=round(random(3,round(maxBars)))
    posLive:=true

long:= flip[1]==true and coinLabel[1]>=5.0
short:= flip[1]==true and coinLabel[1]<5.0


    // Calculate Position Boxes
if long==true and posType!=1

    riskLDEC=1-(risk/100)
    p1:= close[1]*(1+((risk/100)*ratio)) // TargetLine
    p2:=close[1]
    p3:= close[1]*riskLDEC // StopLine
    plotBox:=true
    posType:=1

if short==true and posType!=-1

    riskSDEC=1-((risk*ratio)/100)
    p1:= close[1]*riskSDEC   // TargetLine
    p2:=close[1]
    p3:= close[1]*(1+(risk/100)) // StopLine
    plotBox:=true
    posType:=-1


    // Check Trade Status
stoppedOut:= posType==1 and long==false and low<= p3? true: posType==-1 and short==false and high>=p3? true: false
takeProfit:= posType==1 and long == false and high>= p1? true: posType==-1 and short==false and low<=p1? true: false
if stoppedOut==true or takeProfit==true
    posType:=0
    plotBox:=false
    posLive:=false


// ====== Plots ========
plot1=plot(plotBox and showBox? p1:na,style=plot.style_linebr,color=color.white, transp= 100)
plot2=plot(plotBox and showBox? p2:na,style=plot.style_linebr,color=color.white, transp= 100)
plot3=plot(plotBox and showBox? p3:na,style=plot.style_linebr,color=color.white, transp= 100)
fill(plot1,plot2,color= color.green)
fill(plot2,plot3,color= color.red)
plotshape(flip==true and flip[1]==false and coinLabel>=5.0,style=shape.labelup,location=location.belowbar, color=color.green,size=size.tiny,title="short label",text="Heads",textcolor=color.white)
plotshape(flip==true and flip[1]==false and coinLabel<5.0,style=shape.labeldown,location=location.abovebar, color=color.red,size=size.tiny,title="short label",text="Tails",textcolor=color.white)
if stoppedOut==true
    label.new(bar_index-1, p3, style=label.style_xcross, color=color.orange)
if takeProfit==true
    label.new(bar_index-1, p1, style=label.style_flag, color=color.blue)


if runTest==true and customTime==false or runTest==true and customTime==true and time >= start and time <= end
    strategy.entry("Sell", strategy.short,when=short==true)
    strategy.close("Sell", comment="Close Short", when=stoppedOut==true or takeProfit==true)
    strategy.entry("Long", strategy.long,when=long==true)
    strategy.close("Long",comment="Close Long", when= stoppedOut==true or takeProfit==true )
- N Consecutive Higher Closes Breakout Strategy
- Smart Quantitative Bottom Reversal Trading Strategy
- Bollinger + RSI Double Strategy (Long Only) v1.2
- CCI Zero Cross Trading Strategy
- Dual Moving Average Price Reversal Breakout Strategy
- Moving Average Pullback Trading Strategy
- Moving Average Aggregation Williams Commercial Bid-Ask Pressure Indicator Strategy
- Dual Moving Average Reversal Tracking Strategy
- Moving Average Aggregation MACD Strategy
- EMAskeletonstrategy
- MACD-based Dual Trading Strategy
- Parabolic SAR and CCI Strategy with EMA Exit for Gold Trading
- EMA Momentum Moving Average Crossover Strategy
- Camarilla Pivot Points Breakthrough and Momentum Reversal Low Absorption Golden Cross Strategy
- Donchian Channel With Trailing Stop Loss Strategy
- The Vortex Oscillator Trend Following Strategy
- Intraday Pivot Points Trading Strategy
- Comb Reverse EMA Volume Weighting Optimization Trading Strategies
- Fibonacci Zone DCA Strategy
- Bollinger Bands Reversal Trend Strategy