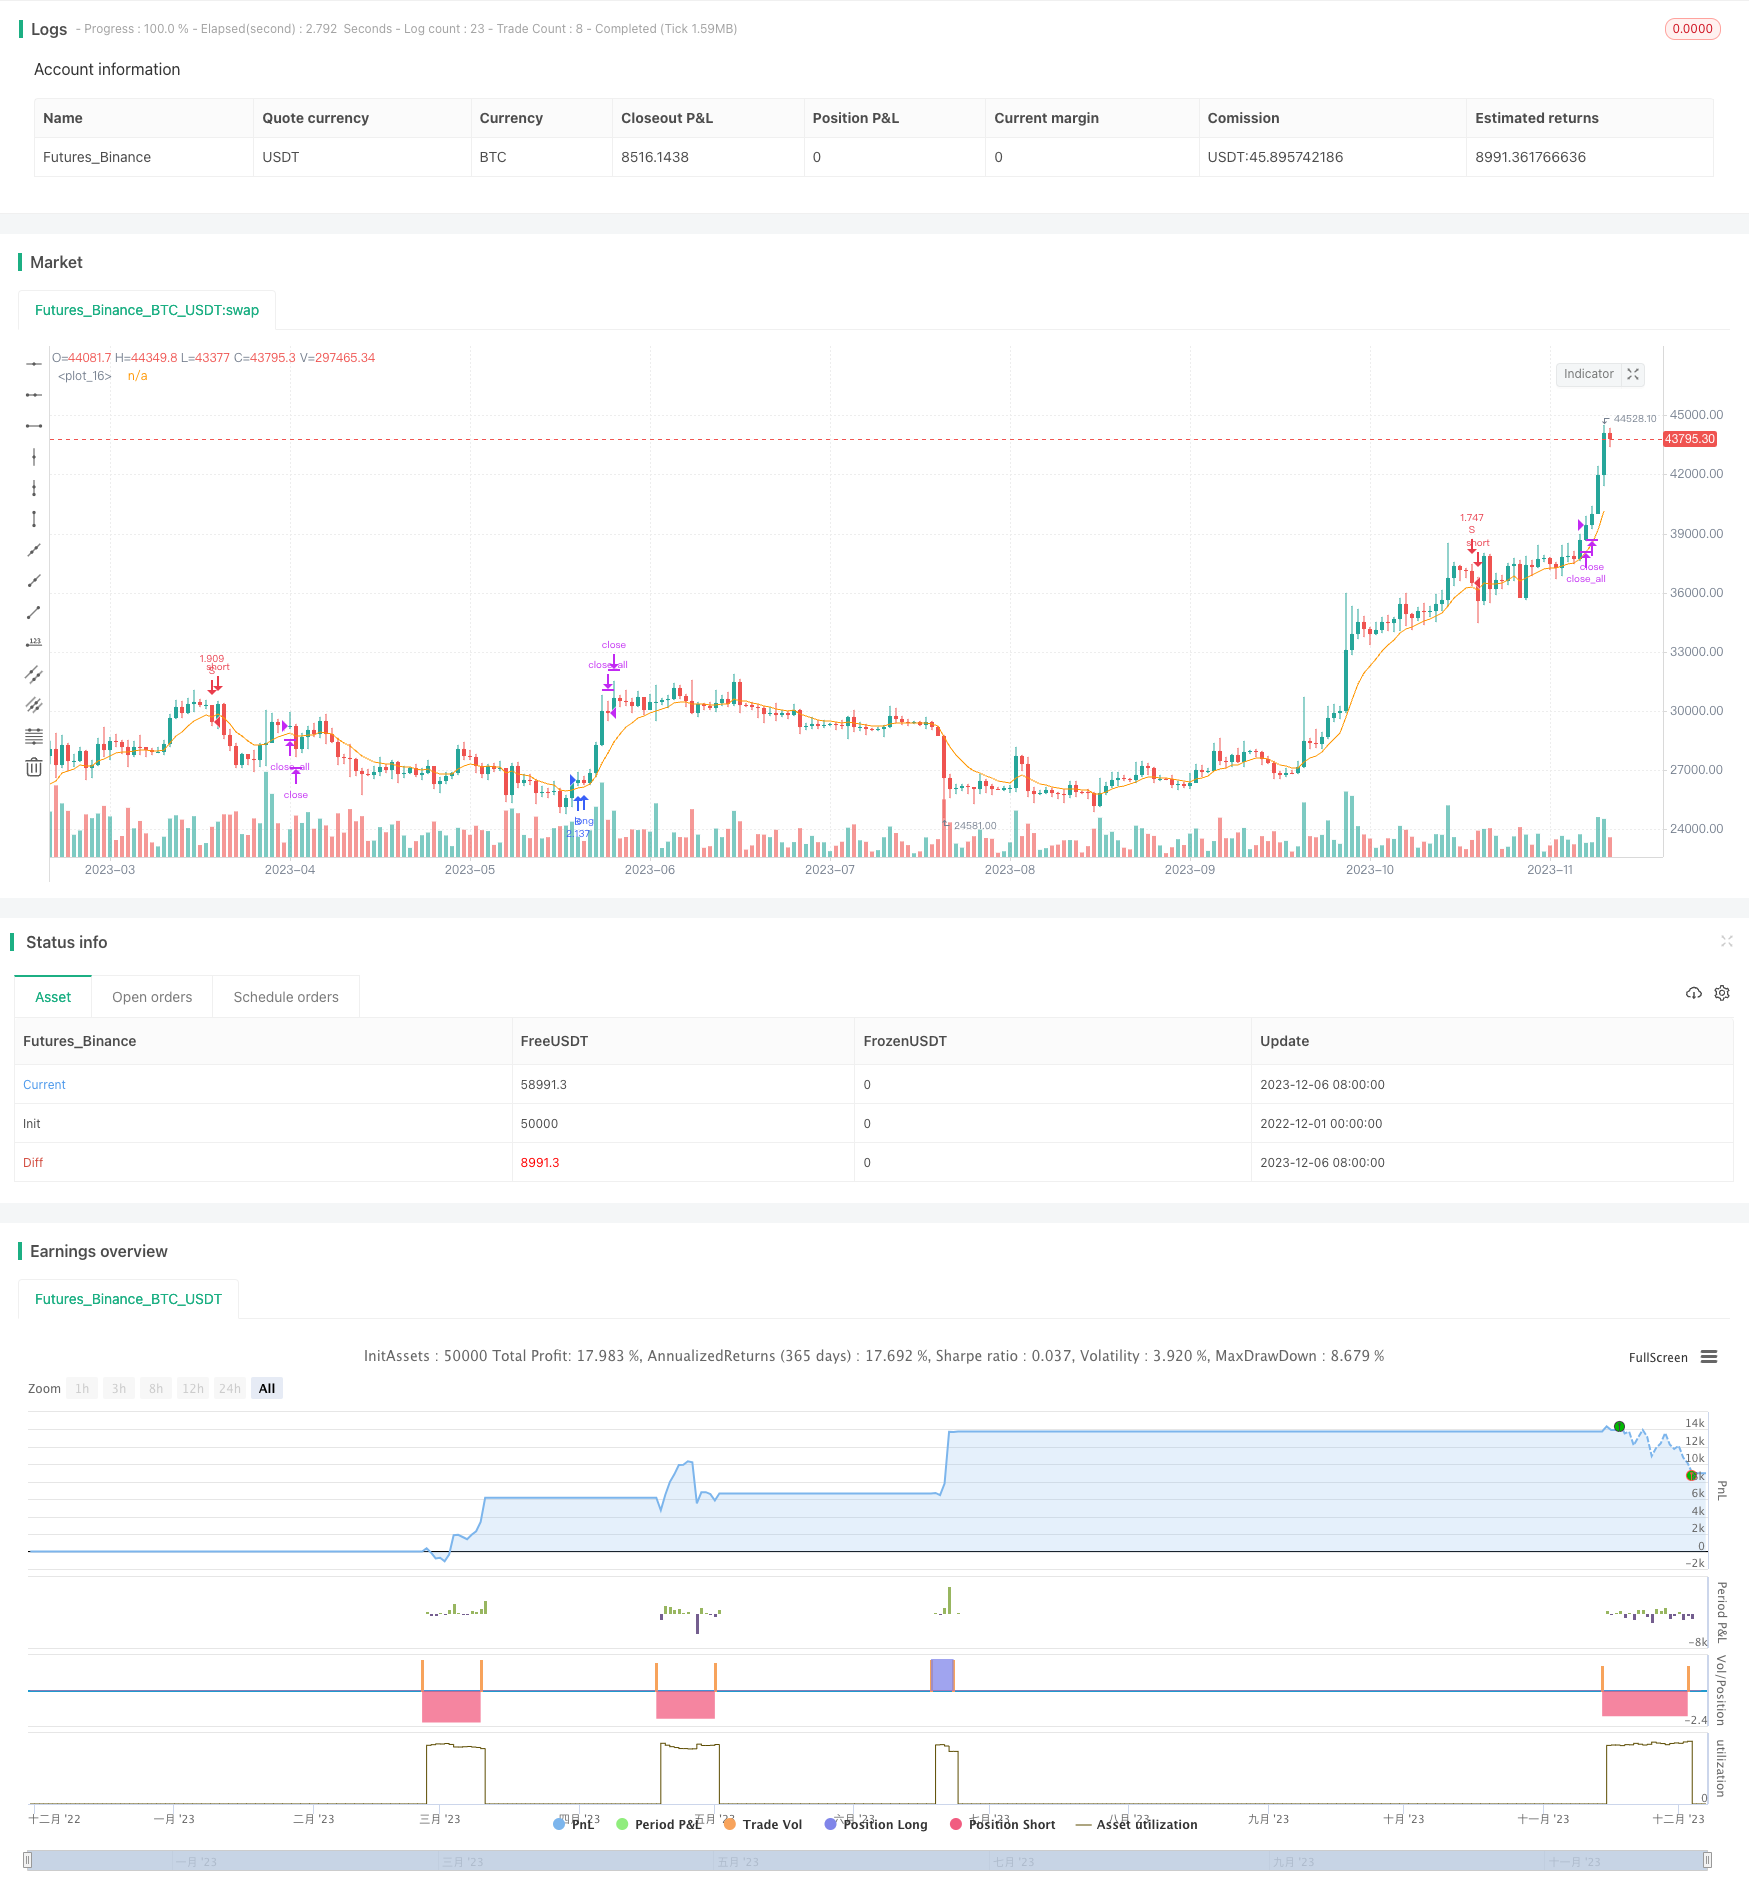
MACD Moving Average Bull Bear Conversion Strategy
Author: ChaoZhang, Date: 2023-12-08 15:29:41Tags:

Overview
The MACD Moving Average Bull Bear Conversion Strategy calculates the DIFF and DEA lines of the MACD indicator to determine whether the market trend has reversed, thereby generating trading signals. It goes long when DIFF crosses above DEA and goes short when DIFF crosses below DEA. The strategy also incorporates price EMA filters to avoid false breakouts.
Strategy Logic
The strategy is mainly based on the DIFF and DEA lines of the MACD indicator. MACD stands for Moving Average Convergence Divergence, consisting of the DIFF, DEA and MACD lines. Among them, DIFF represents the difference between short-term EMA and long-term EMA, DEA is the EMA of DIFF used to verify DIFF signals, and MACD represents the difference between DIFF and DEA, used to identify divergences.
When DIFF breaks above DEA, it means the short-term moving average starts strengthening and the market turns bullish. When DIFF breaks below DEA, it suggests the short-term moving average turns weak and the market becomes bearish. Therefore, this strategy goes long when DIFF crosses above DEA and goes short when crossing below.
In addition, the strategy incorporates price EMA filters to avoid false breakouts. It only goes long when DIFF breaks above DEA and price is below the previous long price, and only goes short when DIFF breaks below DEA and price is above previous short price.
Advantage Analysis
The MACD Moving Average Bull Bear Conversion Strategy combines the MACD indicator and price EMA filters to avoid false signals generated solely by the MACD, thus improving trading performance. This strategy quickly identifies market trend changes and is suitable for short-term trading.
The main advantages include:
- Using MACD to identify trend reversal points and capture turning points
- Incorporating price EMA filters to reduce false breakout opportunities
- Fast signal generation suitable for short-term trading
- Implementing trend following to capture mid-term trend profits
- Aligns with most traders’ thinking pattern of trading at conversion points
Risk Analysis
The MACD Moving Average Bull Bear Conversion Strategy also has some risks:
- MACD is prone to generating false signals, requiring price EMA filters but will also miss some moves
- Need to closely monitor DIFF and DEA lines, improper parameter tuning increases false signals
- Breakout signals only consider 1 bar, with the risk of being whipsawed
- Strategy mainly relies on DIFF/DEA crossover for signals, can increase trade frequency if signals are too frequent
The main ways to optimize risks are:
- Adjust MACD parameters to reduce false signals
- Enhance filter strength to lower whipsaw occurrence
- Add filters on position holding to limit trade frequency
Optimization Directions
The MACD Moving Average Bull Bear Conversion Strategy can be further optimized in the following dimensions:
- Optimize MACD parameters of DIFF/DEA periods
- Add timing filters to lower trading frequency
- Incorporate stop loss/profit take strategies to control profit targets
- Add other indicator filters like BOLL bands and KD
- Incorporate trend bias to avoid counter-trend trading
- Develop exit strategies or profit taking templates based on this strategy framework
Conclusion
The MACD Moving Average Bull Bear Conversion Strategy identifies bullish/bearish market entry by DIFF and DEA crossover signals, and uses price EMA filters to remove false signals, effectively determining market trend reversal points. With simple and clear logic, it quickly identifies conversion points suitable for short-term and mid-term trading. Next steps to optimize include adjusting parameters, enhancing filters, and controlling trade frequency to make the strategy more robust.
/*backtest
start: 2022-12-01 00:00:00
end: 2023-12-07 00:00:00
period: 1d
basePeriod: 1h
exchanges: [{"eid":"Futures_Binance","currency":"BTC_USDT"}]
*/

//@version=3
strategy("macd_strategy",
          shorttitle="macd",
          overlay=true,
          pyramiding=1,
          max_bars_back=5000,
          calc_on_order_fills = false,
          calc_on_every_tick=true,
          default_qty_type=strategy.percent_of_equity,
          default_qty_value=100,
          commission_type =strategy.commission.percent,
          commission_value=0.00075)
[diff, dea, _] = macd(close, 12, 26, 7)
dea_close = ema(diff, 3)
price = ema(close, 9)
plot(price)
cross_over_price = na
cross_over_signal = na
cross_over_price := cross_over_price[1]
cross_over_signal := cross_over_signal[1]

cross_under_price = na
cross_under_signal = na
cross_under_price := cross_under_price[1]
cross_under_signal := cross_under_signal[1]
if (crossover(diff,dea))
    cross_over_price := price[1]
    cross_over_signal := diff
if (crossunder(diff,dea))
    cross_under_price := price[1]
    cross_under_signal := diff
if dea > 0
    cross_over_price = na
    cross_over_signal = na
else
    cross_under_price = na
    cross_under_signal = na
if diff > 0
    if cross_under_price > cross_under_price[1]*1 and cross_under_signal < cross_under_signal[1]*0.95
        strategy.entry("S", strategy.short,  comment="S")
else
    if cross_over_price < cross_over_price[1]*1 and cross_over_signal > cross_over_signal[1]*0.95
        strategy.entry("B", strategy.long,  comment="B")
// strategy.exit("exit_s", "S", stop = strategy.position_avg_price*1.05, when=strategy.position_size < 0)
// strategy.exit("exit_b", "B", stop = strategy.position_avg_price*0.95, when=strategy.position_size > 0)
strategy.close_all(when=(strategy.position_size < 0 and (dea < 0 or diff > cross_under_signal*1 or crossover(diff, dea)) or (strategy.position_size > 0 and (dea > 0 or diff < cross_over_signal*1 or crossunder(diff, dea)))))
- Exponential Moving Average Bounce Strategy
- Price Volatility Breakout Strategy Based on Double Moving Averages
- SuperTrend and DEMA Based Trend Following Strategy
- End of Month Breakout on 200 Day Moving Average Strategy
- OBV Pyramid Strategy Based on Coinrule Script
- Quantitative Trading Based on Moving Average Envelope and ATR Trailing Stop
- ADX Crossover Trend Trading Strategy
- Crypto Bull Run Tracking Strategy
- SuperTrend Engulfing Strategy
- ADX-Based One-Hour TENKAN KIJUN Cross Trend Tracking Strategy
- Moving Average Crossover Strategy
- Price Channel and MACD Based Multi Timeframe Trading Strategy
- Binomial Moving Average Trend Strategy
- Moving Average Crossover Strategy
- Trend and Moving Average Crossover Based Multi-Functional Algorithmic Trading Strategy
- Moving Average Bollinger Bands Breakout Strategy
- Trend Following Grid Strategy
- Quantitative Trading Strategy Integrating Reversal and Future Lines of Demarcation
- Crossing Strategy Between Bollinger Bands and Hull Indicator
- Turtle Breakout Drawdown Adaptive Trading Strategy