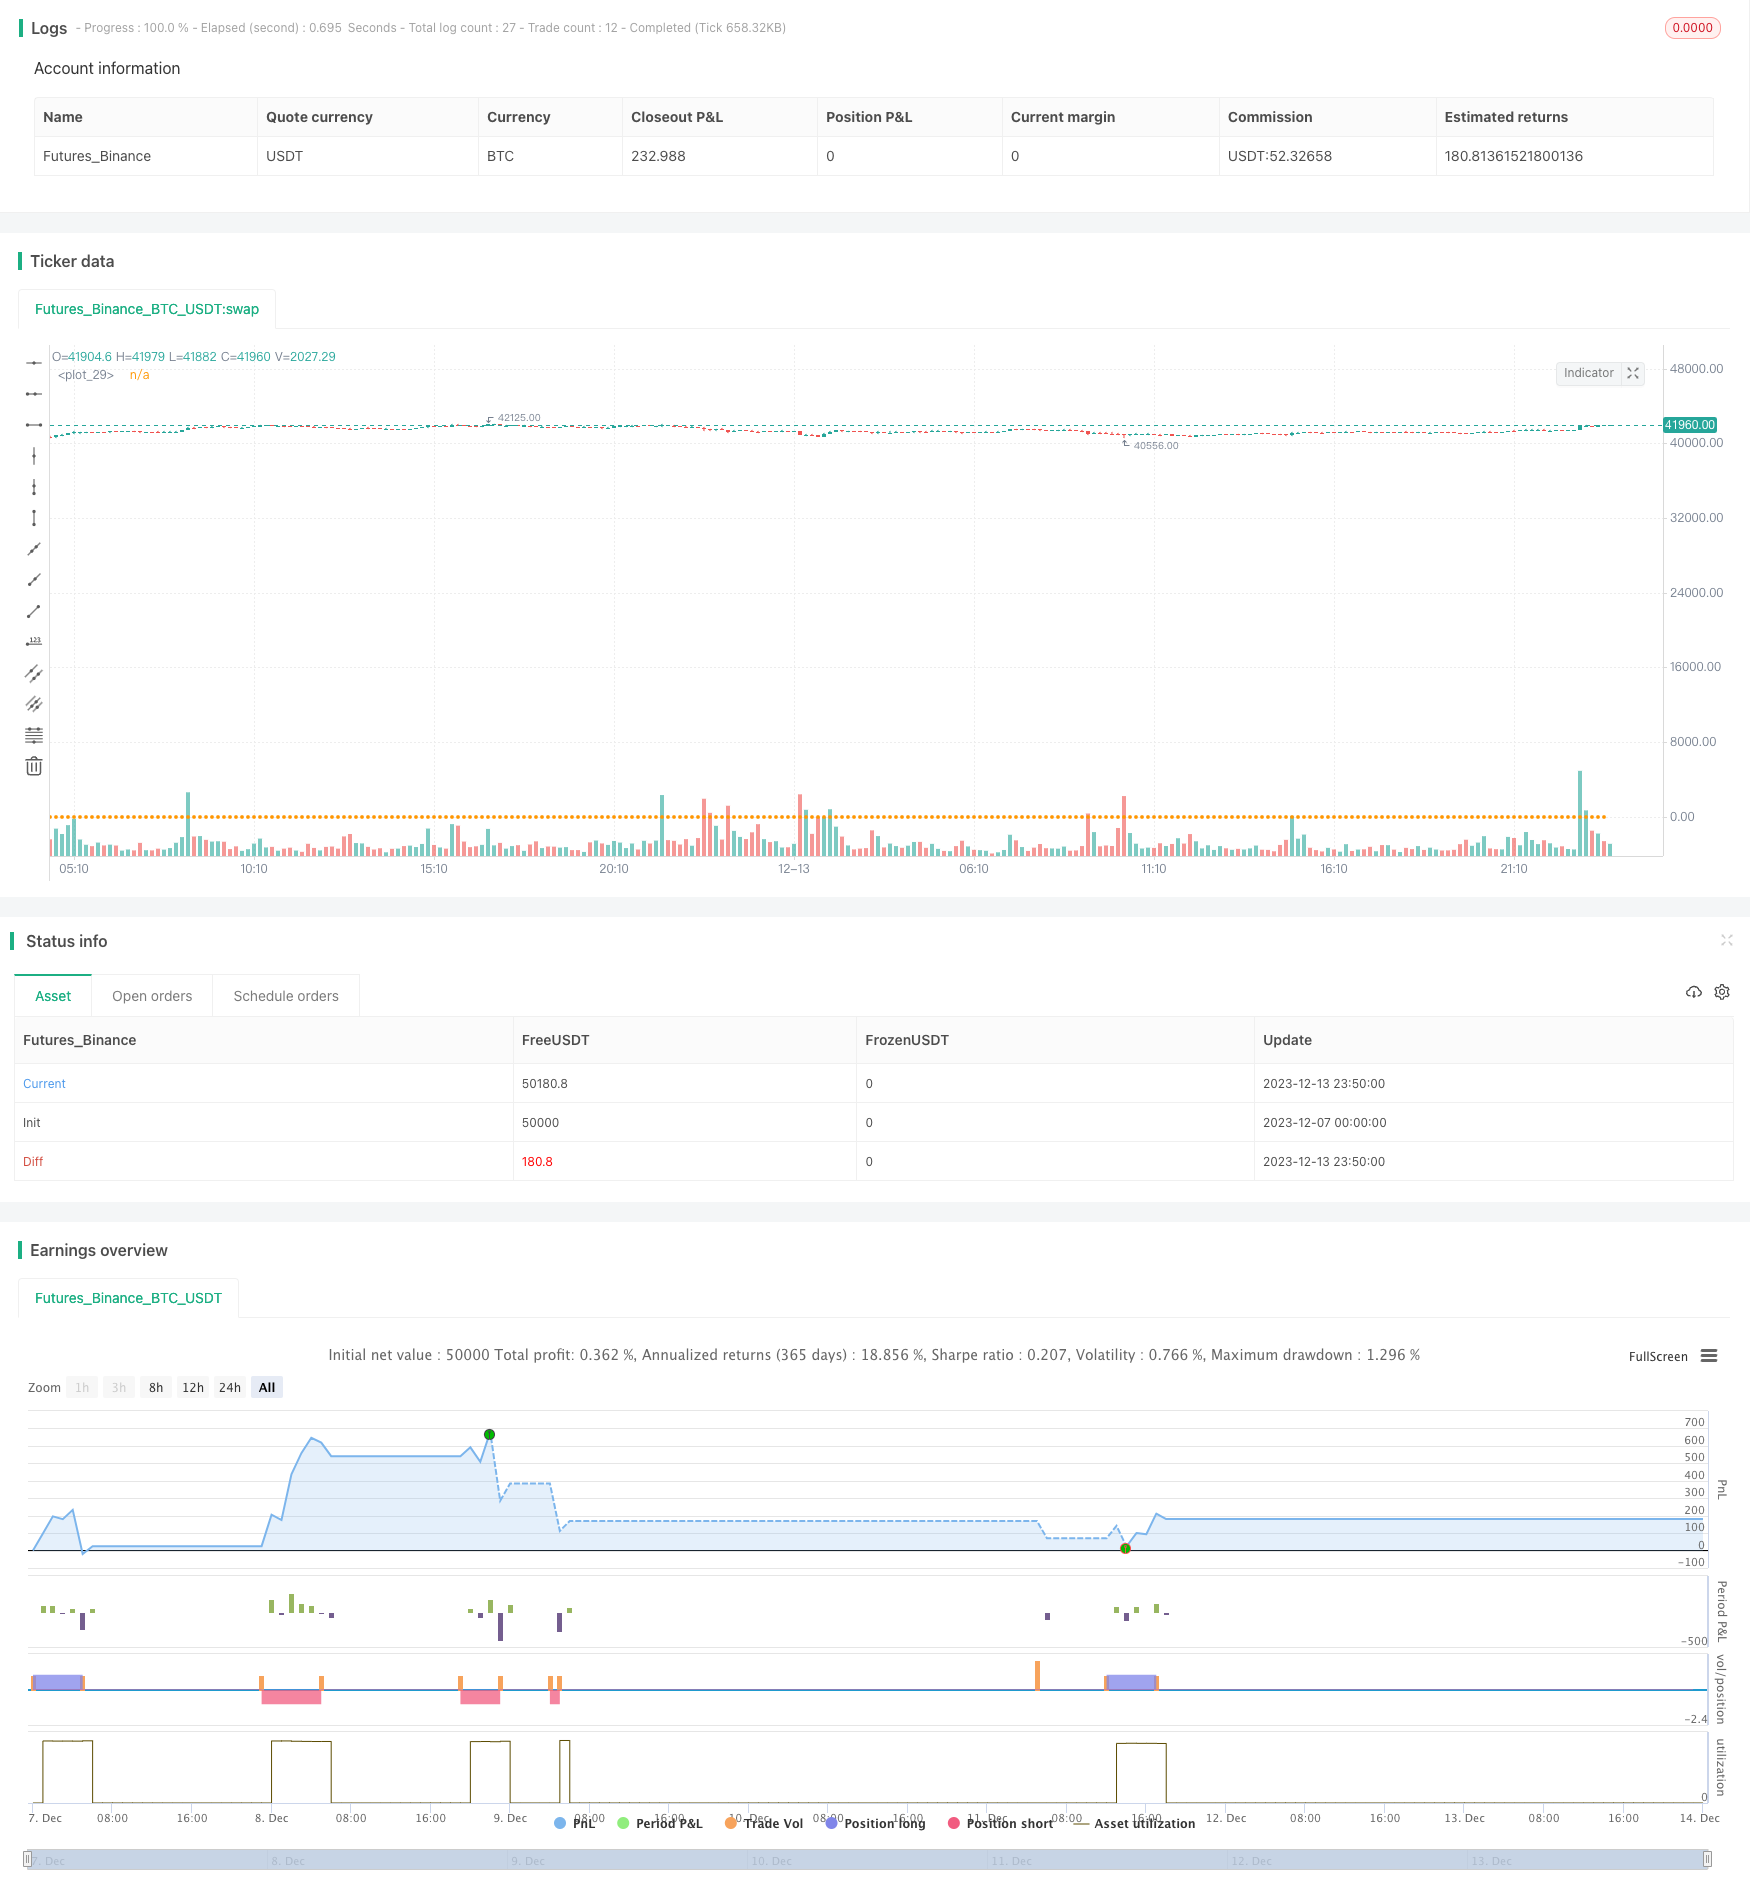
Seven Candlestick Oscillation Breakthrough Strategy
Author: ChaoZhang, Date: 2023-12-15 16:14:32Tags:

Overview
The seven candlestick oscillation breakthrough strategy detects the persistence up and down candlestick patterns formed by seven K-lines to determine market oscillation trends and make breakthrough operations at fixed times to profit.
Strategy Principle
The core logic of this strategy is based on two indicators:
- sevenReds: detecting 7 consecutive declining K-lines, defined as a downward trend in market oscillation
- sevenGreens: detecting 7 consecutive rising K-lines, defined as an upward trend in market oscillation
When sevenReds is detected, go long; when sevenGreens is detected, go short.
In addition, the strategy also closes positions at fixed times (important US data release times) every day to lock in profits.
Advantage Analysis
The seven candlestick oscillation breakthrough strategy has the following advantages:
- Captures market oscillation trends. Seven K-lines filter out market noise and improve signal quality
- Timed operation avoids systemic risks associated with large gap moves around major economic data
- Timely profit-taking locks in gains and reduces drawdowns
Risk Analysis
The seven candlestick oscillation breakthrough strategy also has some risks:
- Pattern recognition error risk. Seven K-lines cannot completely filter noise and may generate incorrect signals
- Lack of stop loss measures to limit per trade loss
- Profit-taking times cannot adjust dynamically, risk of failure to take profits in time
Corresponding solutions:
- Increase number of K-lines, raise persistence threshold
- Add moving stop loss logic
- Dynamically adjust profit-taking time based on volatility indicators
Optimization Directions
The seven candlestick oscillation breakthrough strategy can be optimized in the following aspects:
- Add multiple security pools for index/sector rotation
- Add machine learning models to aid market regime prediction
- Incorporate moving averages for optimized entry signals
- Dynamically adjust position sizing based on drawdown to control risk
Conclusion
The seven candlestick oscillation breakthrough strategy profits by capturing short-term oscillation trends in the market, while using timed execution to avoid major risks and taking profits to lock in gains. The strategy can be enhanced via multi-asset rotation, machine learning etc. It is a typical medium-frequency quantitative trading strategy.
/*backtest
start: 2023-12-07 00:00:00
end: 2023-12-14 00:00:00
period: 10m
basePeriod: 1m
exchanges: [{"eid":"Futures_Binance","currency":"BTC_USDT"}]
*/

// This source code is subject to the terms of the Mozilla Public License 2.0 at https://mozilla.org/MPL/2.0/
// © Eliza123123

//@version=5
strategy("Breakeven Line Demo", overlay=true)

// Generic signal (not a viable strategy don't use, just some code I wrote quick for demo purposes only)
red = open > close, green = open < close
sevenReds = red and red[1] and red[2] and red[3] and red[4] and red[5] and red[6]
sevenGreens = green and green[1] and green[2] and green[3] and green[4] and green[5] and green[6]
if sevenReds
    strategy.entry('Buy', direction=strategy.long)
if sevenGreens
    strategy.entry('Sell', direction=strategy.short)
if (hour == 5 and minute == 0 ) or (hour == 11 and minute == 0) or (hour == 17 and minute == 0 ) or (hour == 23 and minute == 0)
    strategy.close_all("Close")

// Breakeven line for visualising breakeven price on stacked orders.
var breakEvenLine = 0.0
if strategy.opentrades > 0
    breakEvenLine := strategy.position_avg_price
else
    breakEvenLine := 0.0
color breakEvenLineColor = na
if strategy.position_size > 0
    breakEvenLineColor := #15FF00
if strategy.position_size < 0
    breakEvenLineColor := #FF000D
plot(breakEvenLine, color = breakEvenLine and breakEvenLine[1] > 0 ? breakEvenLineColor : na, linewidth = 2, style = plot.style_circles)
- SMA and PSAR Strategy for Spot Trading
- SMA and RSI Long Only Strategy
- Dual Moving Average Reversal Breakout Strategy
- Trend Following Strategy Based on Ichimoku Cloud
- High Frequency Trading Strategy Based on Bollinger Bands and StochRSI Indicators
- Dual Reversion Balance Strategy
- HYE Mean Reversion SMA Strategy
- Dual Moving Average Reversal Strategy
- Dual Direction Price Breakthrough Moving Average Timing Trading Strategy
- Bollinger Breakout Stock Strategy
- Golden Dead Cross Trend Tracking Strategy
- Quantitative Trading Strategy Based on TRSI and SUPER Trend Indicators
- An Intraday Trend Following Quantitative Strategy Based on Multi-indicator Condition Filtering
- Bollinger Bands and RSI Short Selling Strategy
- Reverse Trading Strategy Based on Overlapping Price Differentials
- Price Deviation from Daily Average Trading Strategy
- Dual Moving Average Triple Exponential Indicator Trading Strategy
- Momentum Indicator Decision Trading Strategy
- MACD Long Reversal Strategy
- Dual Timeframe Trend Tracking Strategy