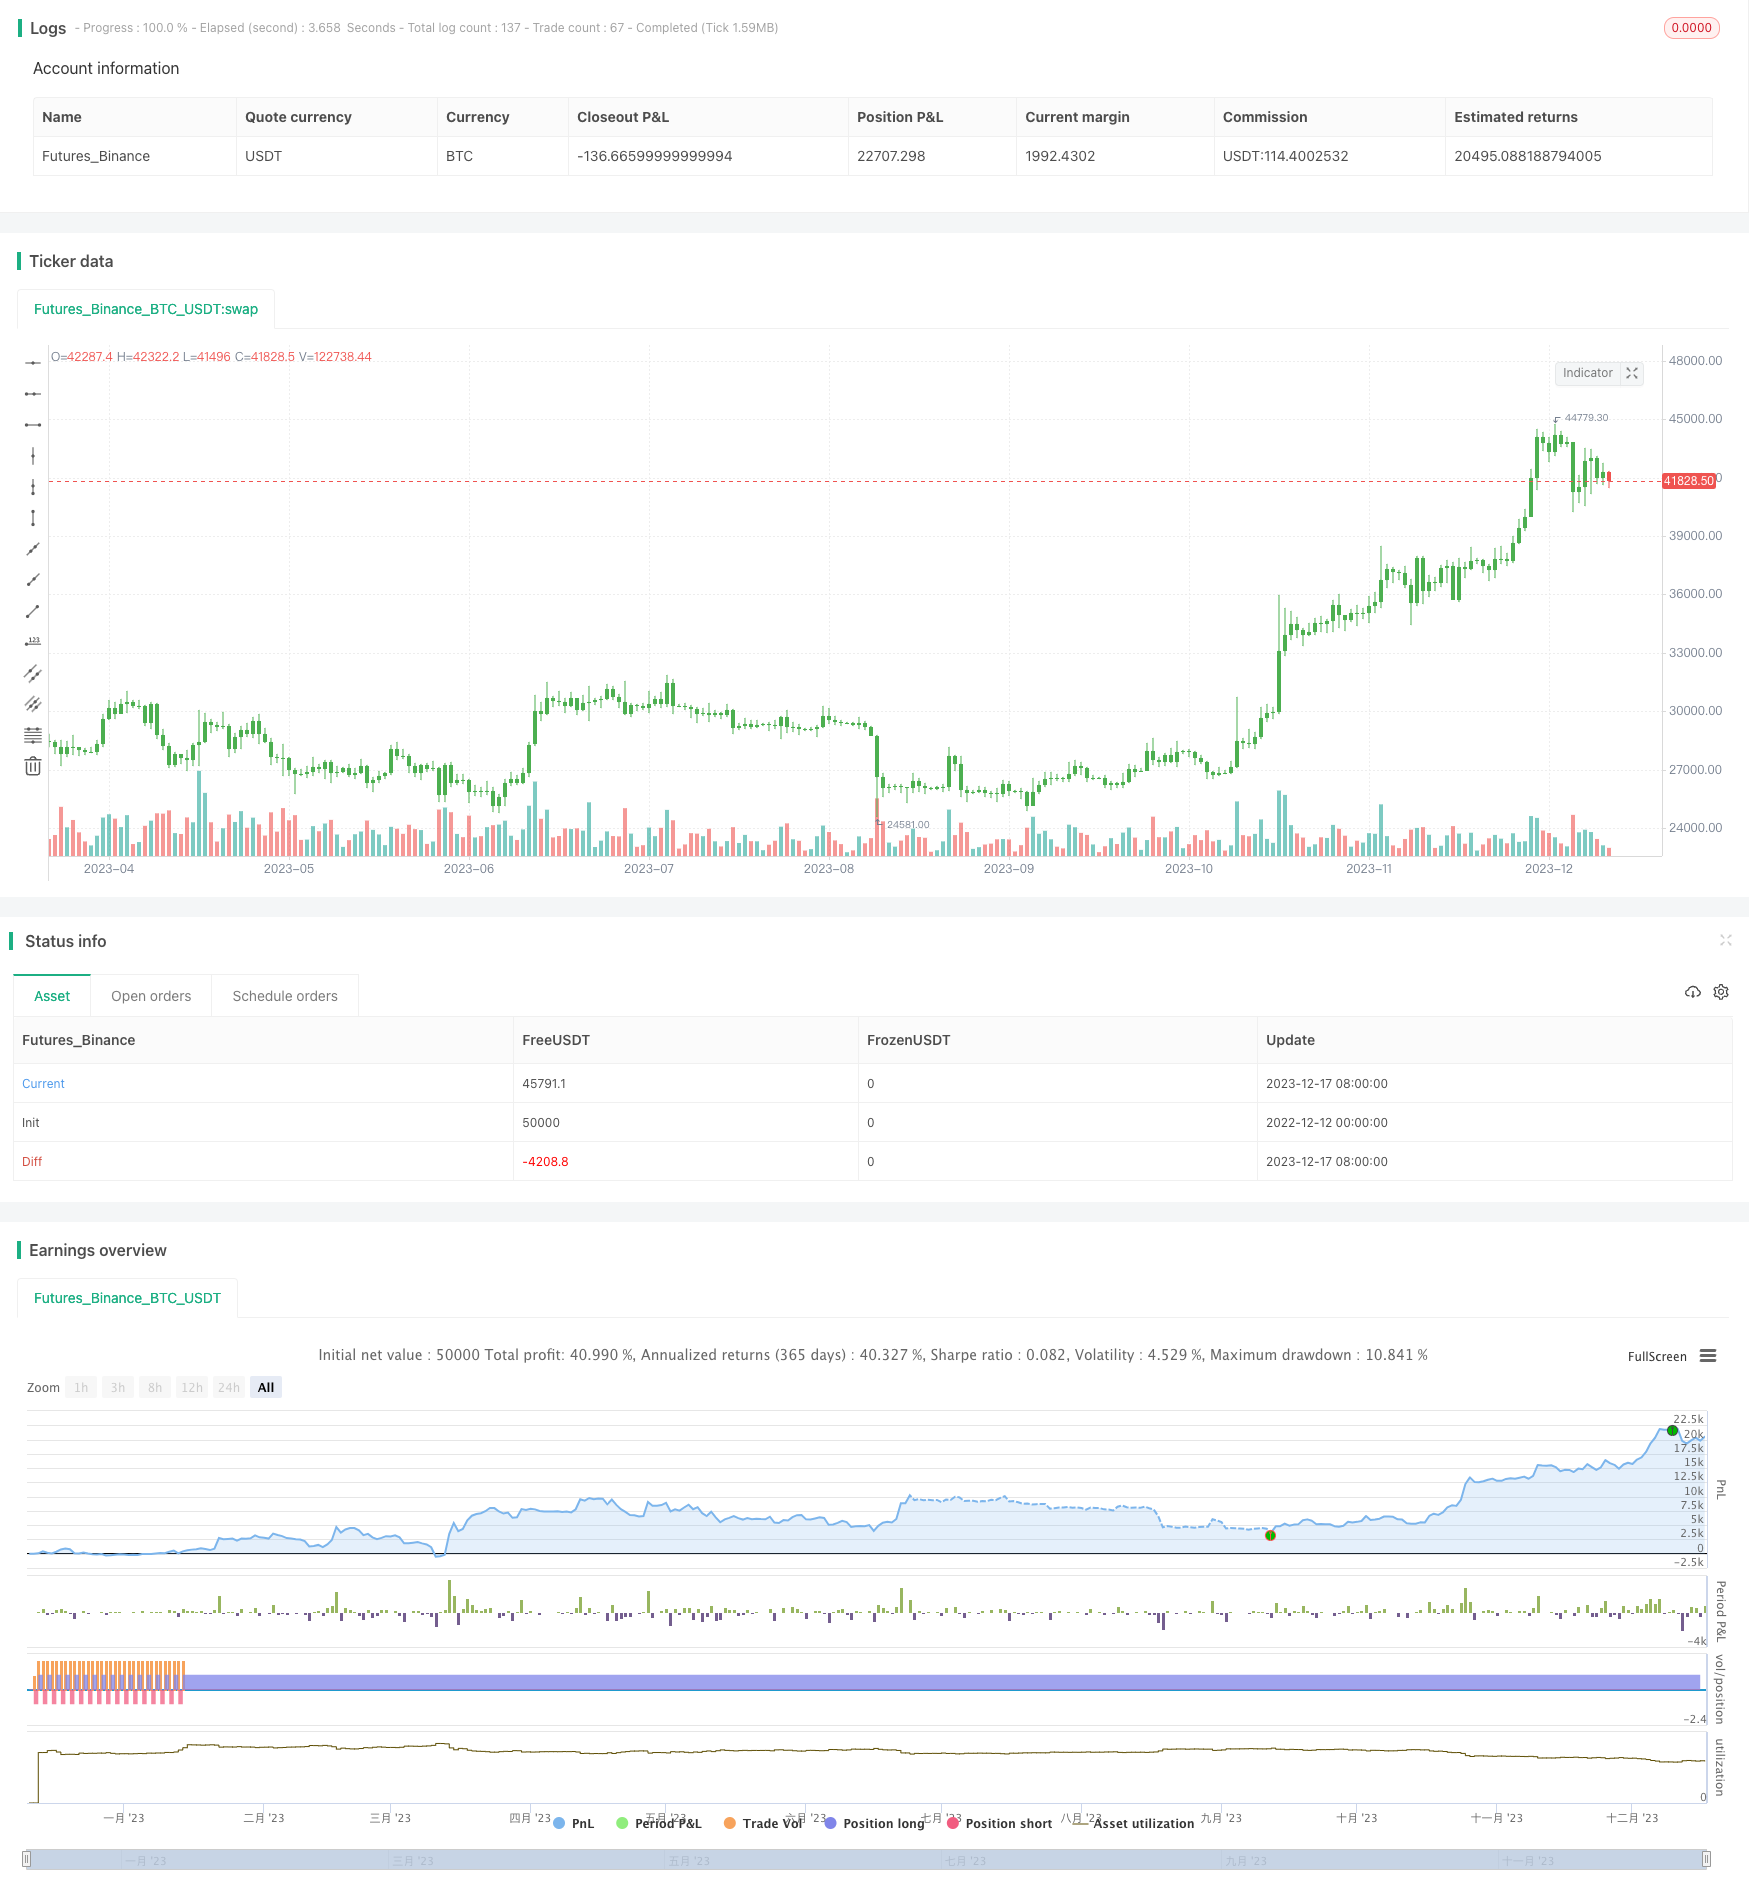
Trend Tracking Strategy Based on Multi-factor Model with Adaptive Trailing Stoploss
Author: ChaoZhang, Date: 2023-12-19 11:04:27Tags:

Overview
This strategy is a trend tracking strategy driven by a multi-factor model with adaptive trailing stoploss. It incorporates multiple indicators like RSI, MACD, Stochastics to build a multi-factor model to determine the trend direction. Meanwhile, it features an adaptive trailing stoploss mechanism that dynamically adjusts stoploss price based on ATR to realize risk control.
Principles
This strategy leverages multiple indicators to build a model for judging trend. Firstly, it combines RSI and MACD to determine trend direction; then it uses Stochastics to filter excessively overbought or oversold signals. After entering orders, it utilizes ATR to calculate risk parameter and implement adaptive stoploss.
Specifically, it generates buy signal when RSI is above 52 and MACD golden cross happens; it generates sell signal when RSI is below 48 and MACD dead cross occurs. To filter fake signals, it also detects whether Stochastics is overbought or oversold. For stoploss, it calculates parameter based on ATR to realize adaptive stoploss, which can effectively control single stoploss risk.
Advantages
The biggest advantage of this strategy lies in its strong risk control capability. By judging trend direction with multi-factor model, it can filter some noise and improve signal quality. Meanwhile, the adaptive stoploss mechanism can adjust stoploss range based on market volatility to effectively control single loss.
In addition, parameters of this strategy are reasonably set with good backtesting results. Different cycle assets can achieve optimization through parameter tuning. It can fit more market environments through parameter optimization.
Risks
The main risk of this strategy is the quality of multi-factor model construction. If the model fails to effectively determine the trend, it would generate massive fake signals. Also, stoploss strategies inherently bear the risk of being hunted.
To mitigate these risks, improvements can be made from aspects like adjusting model weight, optimizing parameter settings, combining with other stoploss strategies. Manual intervention is also necessary when abnormal market occurs.
Optimization Directions
This strategy can be optimized from the following aspects:
-
Adjust weights of indicators in the multi-factor model to find optimal combination
-
Test more indicators like CCI, volatility etc to enrich the multi-factor model
-
Optimize parameter settings to fit more products and cycles
-
Try different stoploss strategies to find optimal combination
-
Add model training and strategy assessment modules to enable machine learning drive
Summary
This strategy integrates multi-factor model and adaptive stoploss mechanism to achieve organic combination of trend judgment and risk control. It has good backtesting results and scalability. With continuous optimization, it can become a quantitative strategy worthwhile for long term holding.
/*backtest
start: 2022-12-12 00:00:00
end: 2023-12-18 00:00:00
period: 1d
basePeriod: 1h
exchanges: [{"eid":"Futures_Binance","currency":"BTC_USDT"}]
*/

//@version=2
strategy(title="TradersAI_UTBot", overlay = true)
// CREDITS to @HPotter for the orginal code.
// CREDITS to @Yo_adriiiiaan for recently publishing the UT Bot study based on the original code -
// I just added some simple code to turn it into a strategy so that you all can backtest it to see the results for yourself!
// Use this strategy on your favorite instrumnet and timeframe, with your favorite settings
// While @Yo_adriiiiaan mentions it works best on a 4-hour timeframe or above,
// I am  happy to share here this working on a 15-minute chart on e-mini S&P 500 Index (using the KeyValue setting at 10)
// I am sure different people would discover different settings that work best for their preferred instrumnet/timeframe etc.
// Play with it and enjoy! And, don't forget to share any positive results you might get! Good luck with your trading!

SOURCE = input(hlc3)
RSILENGTH = input(14, title = "RSI LENGTH")
RSICENTERLINE = input(52, title = "RSI CENTER LINE")
MACDFASTLENGTH = input(7, title = "MACD FAST LENGTH")
MACDSLOWLENGTH = input(12, title = "MACD SLOW LENGTH")
MACDSIGNALSMOOTHING = input(12, title = "MACD SIGNAL SMOOTHING")
a = input(10, title = "Key Vaule. 'This changes the sensitivity'")
SmoothK = input(3)
SmoothD = input(3)
LengthRSI = input(14)
LengthStoch = input(14)
RSISource = input(close)
c = input(10, title="ATR Period")
xATR = atr(c)
nLoss = a * xATR
xATRTrailingStop = iff(close > nz(xATRTrailingStop[1], 0) and close[1] > nz(xATRTrailingStop[1], 0), max(nz(xATRTrailingStop[1]), close - nLoss),
     iff(close < nz(xATRTrailingStop[1], 0) and close[1] < nz(xATRTrailingStop[1], 0), min(nz(xATRTrailingStop[1]), close + nLoss),
     iff(close > nz(xATRTrailingStop[1], 0), close - nLoss, close + nLoss)))
pos =	iff(close[1] < nz(xATRTrailingStop[1], 0) and close > nz(xATRTrailingStop[1], 0), 1,
     iff(close[1] > nz(xATRTrailingStop[1], 0) and close < nz(xATRTrailingStop[1], 0), -1, nz(pos[1], 0)))
color = pos == -1 ? red: pos == 1 ? green : blue
ema= ema(close,1)
above = crossover(ema,xATRTrailingStop )
below = crossover(xATRTrailingStop,ema)
buy = close > xATRTrailingStop and above
sell = close < xATRTrailingStop and below
barbuy = close > xATRTrailingStop
barsell = close < xATRTrailingStop
plotshape(buy, title = "Buy", text = 'Buy', style = shape.labelup, location = location.belowbar, color= green,textcolor = white, transp = 0, size = size.tiny)
plotshape(sell, title = "Sell", text = 'Sell', style = shape.labeldown, location = location.abovebar, color= red,textcolor = white, transp = 0, size = size.tiny)
barcolor(barbuy? green:na)
barcolor(barsell? red:na)
alertcondition(buy, title='Buy', message='Buy')
alertcondition(sell, title='Sell', message='Sell')

if(buy)
    strategy.entry("UTBotBuy",strategy.long)
if(sell)
    strategy.entry("UTBotSell",strategy.short)
- The Wave Trend Trading Strategy Based on LazyBear
- Eight Day Extended Run Strategy
- Moving Average Pullback Strategy
- Dynamic MA Crossover Trend Following Strategy
- Stochastic Moving Average Strategy
- Momentum Oscillation Crossing Bollinger Bands with Moving Average Strategy
- RSI Bollinger Bands Short-term Trading Strategy
- Super Trend Tracking Stop Loss Strategy
- MACD Trend Following Intraday Strategy
- Dual Factor Mean Reversion Tracking Strategy
- Multi-indicator Combination Adaptive Trend Strategy
- Candlestick Patterns Trading Strategy
- SMA Offset Fluctuation Trading Strategy
- Strategy Based on 5-10-20 Day EMA Crossover Using Super Trend Confirmation
- Momentum Breakthrough Moving Average Trading Strategy
- MACD and RSI Based Trend Following Reversal Strategy
- RSI Channel Price Difference Tracking Strategy
- Solid and Steady SMA Position Holding Strategy
- Momentum TD Reversal Trading Strategy
- Trend Following Regression Trading Strategy Based on Linear Regression and Moving Average