Trend Trading Strategy Based on Dynamic Moving Average
Author: ChaoZhang, Date: 2023-12-21 11:33:50Tags:

Overview
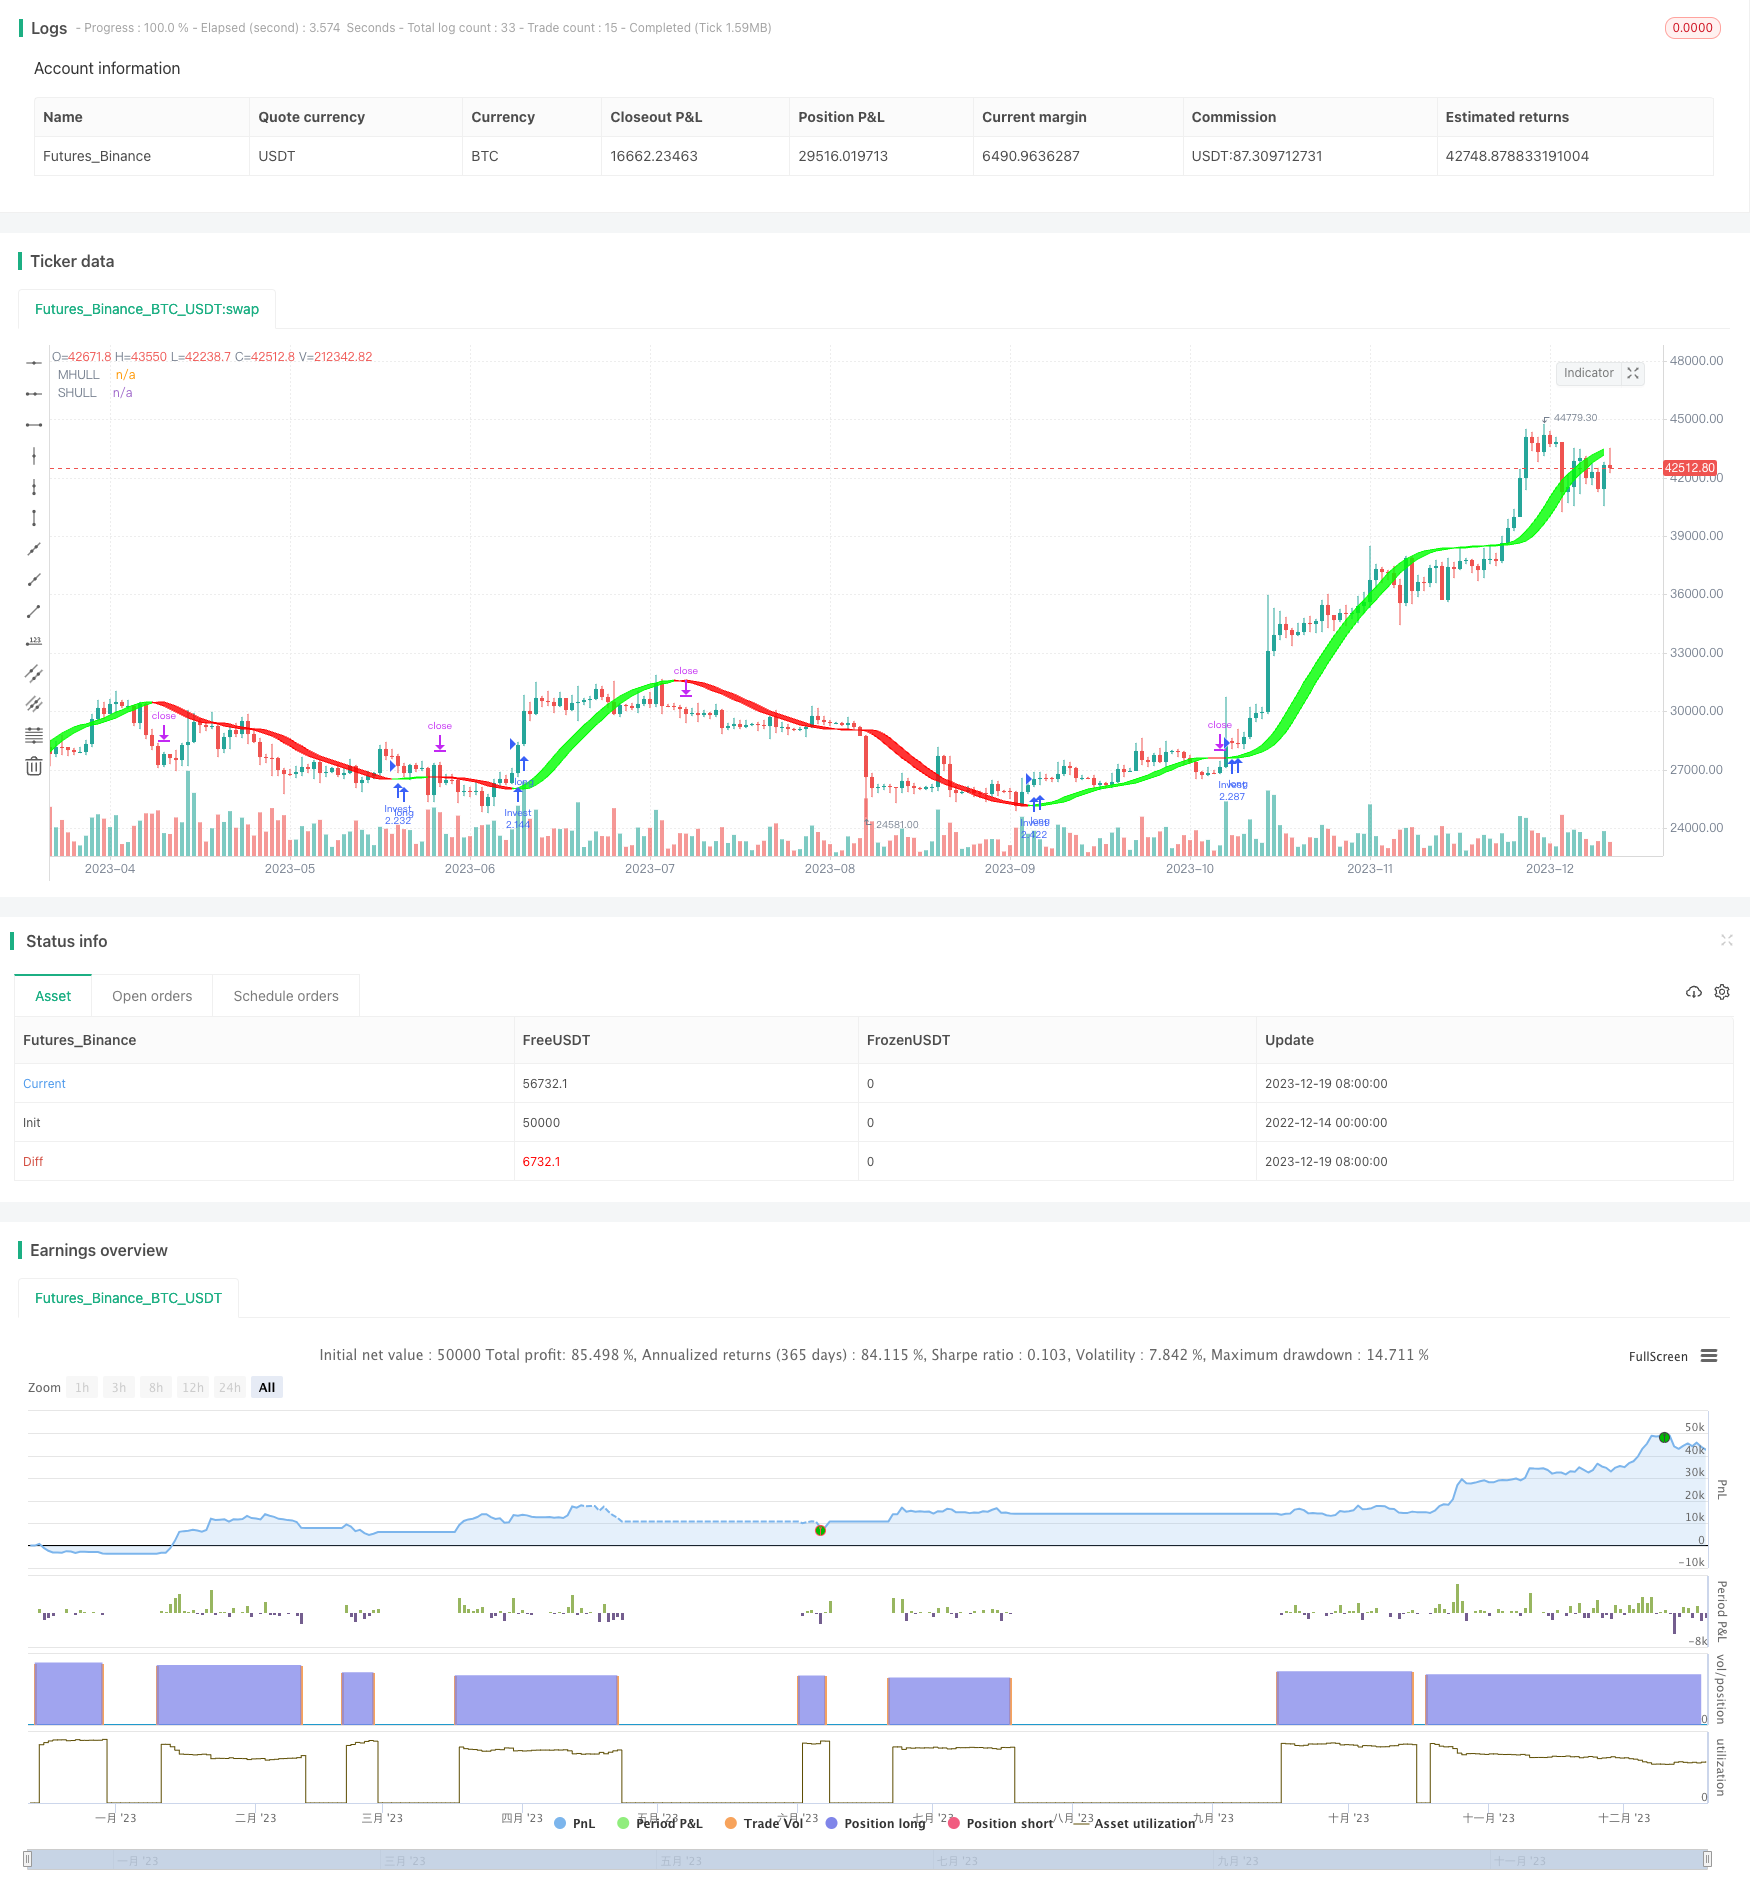
This strategy generates trading signals based on the dynamic moving average to go long when stock prices rise and close positions when prices fall. By combining the advantages of momentum indicators and moving averages, it aims at tracking medium-term price trends for steady profits.
Principle
The strategy mainly relies on three Hull Moving Average (HMA) variants – regular HMA, Weighted HMA (WHMA) and Exponential HMA (EHMA). As the code shows, it allows users to switch between the three Hull MAs.
The formula for HMA is:
HMA = WMA(2*WMA(close, n/2)-WMA(close, n), sqrt(n))
Where WMA is the Weighted Moving Average and n is the period parameter. Compared to SMA, HMA responds faster to price changes.
The formulas for WHMA and EHMA are similar. HMA is chosen as the default option.
After calculating the HMA, the strategy uses the midline value of HMA as trading signals. It goes long when the price crosses above the HMA midline and closes positions when the price falls below the line. Thus it tracks medium-term trends using the HMA midline for profits.
Advantages
Compared to traditional MA strategies, this strategy has the following edges:
- Faster response and stronger trend-following ability for timely entries and stops
- Lower unnecessary trade frequency, avoiding chasing surges and stops
- Flexible HMA parameters for adapting to more market environments
- Switchable HMA variants to expand applicability
Risks
There are also some risks:
- Generating multiple false signals during range-bound markets, increasing trade frequency and slippage costs
- Missing trend reversal points if HMA parameters are not set properly, leading to greater loss risks
- Liquidity risk and huge slippage when trading low liquidity stocks
Solutions:
- Optimize HMA parameters for best values
- Add other indicators to determine trend reversal points
- Select liquid stocks with large average daily volume
Improvements
The strategy can also be enhanced from the following aspects:
- Add volume or other filters to ensure signal reliability
- Combine MACD, KDJ for better timing, improving win rate
- Adjust HMA periods based on real-trade backtests
- Switch to WHMA or EHMA that performs the best for specific stocks
- Add stop loss mechanisms to control single trade loss
Summary
The dynamic MA trading strategy integrates the fast response of HMA to effectively track medium-term price trends. By opening long positions at appropriate timing and closing stops, it has demonstrated good backtest results. Further improvements in parameter tuning and stock filtering would lead to more steady excess returns. It is an easy-to-implement, risk-controllable quantitative strategy.
/*backtest
start: 2022-12-14 00:00:00
end: 2023-12-20 00:00:00
period: 1d
basePeriod: 1h
exchanges: [{"eid":"Futures_Binance","currency":"BTC_USDT"}]
*/

//@version=5
strategy('Position Investing by SirSeff', overlay=true, pyramiding=1, default_qty_type=strategy.percent_of_equity, default_qty_value=100, calc_on_order_fills=false, slippage=0, commission_type=strategy.commission.percent, commission_value=0)
strat_dir_input = input.string(title='Strategy Direction', defval='long', options=['long', 'short', 'all'])
strat_dir_value = strat_dir_input == 'long' ? strategy.direction.long : strat_dir_input == 'short' ? strategy.direction.short : strategy.direction.all
strategy.risk.allow_entry_in(strat_dir_value)
//////////////////////////////////////////////////////////////////////
// Testing Start dates
testStartYear = input(2000, 'Backtest Start Year')
testStartMonth = input(1, 'Backtest Start Month')
testStartDay = input(1, 'Backtest Start Day')
testPeriodStart = timestamp(testStartYear, testStartMonth, testStartDay, 0, 0)
//Stop date if you want to use a specific range of dates
testStopYear = input(2030, 'Backtest Stop Year')
testStopMonth = input(12, 'Backtest Stop Month')
testStopDay = input(30, 'Backtest Stop Day')
testPeriodStop = timestamp(testStopYear, testStopMonth, testStopDay, 0, 0)


testPeriod() => true
// Component Code Stop
//////////////////////////////////////////////////////////////////////
//INPUT
src = input(close, title='Source')
modeSwitch = input.string('Hma', title='Hull Variation', options=['Hma', 'Thma', 'Ehma'])
length = input(55, title='Length(180-200 for floating S/R , 55 for swing entry)')
switchColor = input(true, 'Color Hull according to trend?')
candleCol = input(false, title='Color candles based on Hull\'s Trend?')
visualSwitch = input(true, title='Show as a Band?')
thicknesSwitch = input(1, title='Line Thickness')
transpSwitch = input.int(40, title='Band Transparency', step=5)

//FUNCTIONS
//HMA
HMA(_src, _length) =>
    ta.wma(2 * ta.wma(_src, _length / 2) - ta.wma(_src, _length), math.round(math.sqrt(_length)))
//EHMA
EHMA(_src, _length) =>
    ta.ema(2 * ta.ema(_src, _length / 2) - ta.ema(_src, _length), math.round(math.sqrt(_length)))
//THMA
THMA(_src, _length) =>
    ta.wma(ta.wma(_src, _length / 3) * 3 - ta.wma(_src, _length / 2) - ta.wma(_src, _length), _length)

//SWITCH
Mode(modeSwitch, src, len) =>
    modeSwitch == 'Hma' ? HMA(src, len) : modeSwitch == 'Ehma' ? EHMA(src, len) : modeSwitch == 'Thma' ? THMA(src, len / 2) : na

//OUT
HULL = Mode(modeSwitch, src, length)
MHULL = HULL[0]
SHULL = HULL[2]

//COLOR
hullColor = switchColor ? HULL > HULL[2] ? #00ff00 : #ff0000 : #ff9800

//PLOT
///< Frame
Fi1 = plot(MHULL, title='MHULL', color=hullColor, linewidth=thicknesSwitch, transp=50)
Fi2 = plot(visualSwitch ? SHULL : na, title='SHULL', color=hullColor, linewidth=thicknesSwitch, transp=50)
///< Ending Filler
fill(Fi1, Fi2, title='Band Filler', color=hullColor, transp=transpSwitch)
///BARCOLOR
barcolor(color=candleCol ? switchColor ? hullColor : na : na)


if HULL[0] > HULL[2] and testPeriod()
    strategy.entry('Invest', strategy.long)
if HULL[0] < HULL[2] and testPeriod()
    strategy.entry('Pause', strategy.short)
- Dynamic Weighted Moving Average Trading Strategy
- Last Candle Strategy
- Quantitative Strategy of Negative Volume Index Reversal
- Triple Supertrend Breakout Strategy
- MACD of Relative Strength Strategy
- Triple Dragon System
- Top Trading Only Based on Weekly EMA8 Strategy
- EMA Pullback Strategy
- Dual Moving Average Trend Tracking Strategy
- Automated Quantitative Trading Strategy Based on Inside Bar and Moving Average
- Relative Strength Index and Moving Average Crossover Strategy
- An Oscillating Momentum Reversal Moving Average Crossover Strategy
- RSI Bollinger Bands TP/SL Strategy
- Ichimoku Cloud Quant Scalping Strategy
- Ergotic Dual-rail Reverse MACD Quantitative Trading Strategy
- Dual Indicator Quantitative Strategy
- Interactive Model Based Candlestick Trading Strategy
- DEMA MACD Combination Strategy
- Ichimoku Yin Yang Candlestick Breakout Strategy
- Liquidity Driven Trend Strategy - A Quant Trading Strategy Based on Flow Trend Indication