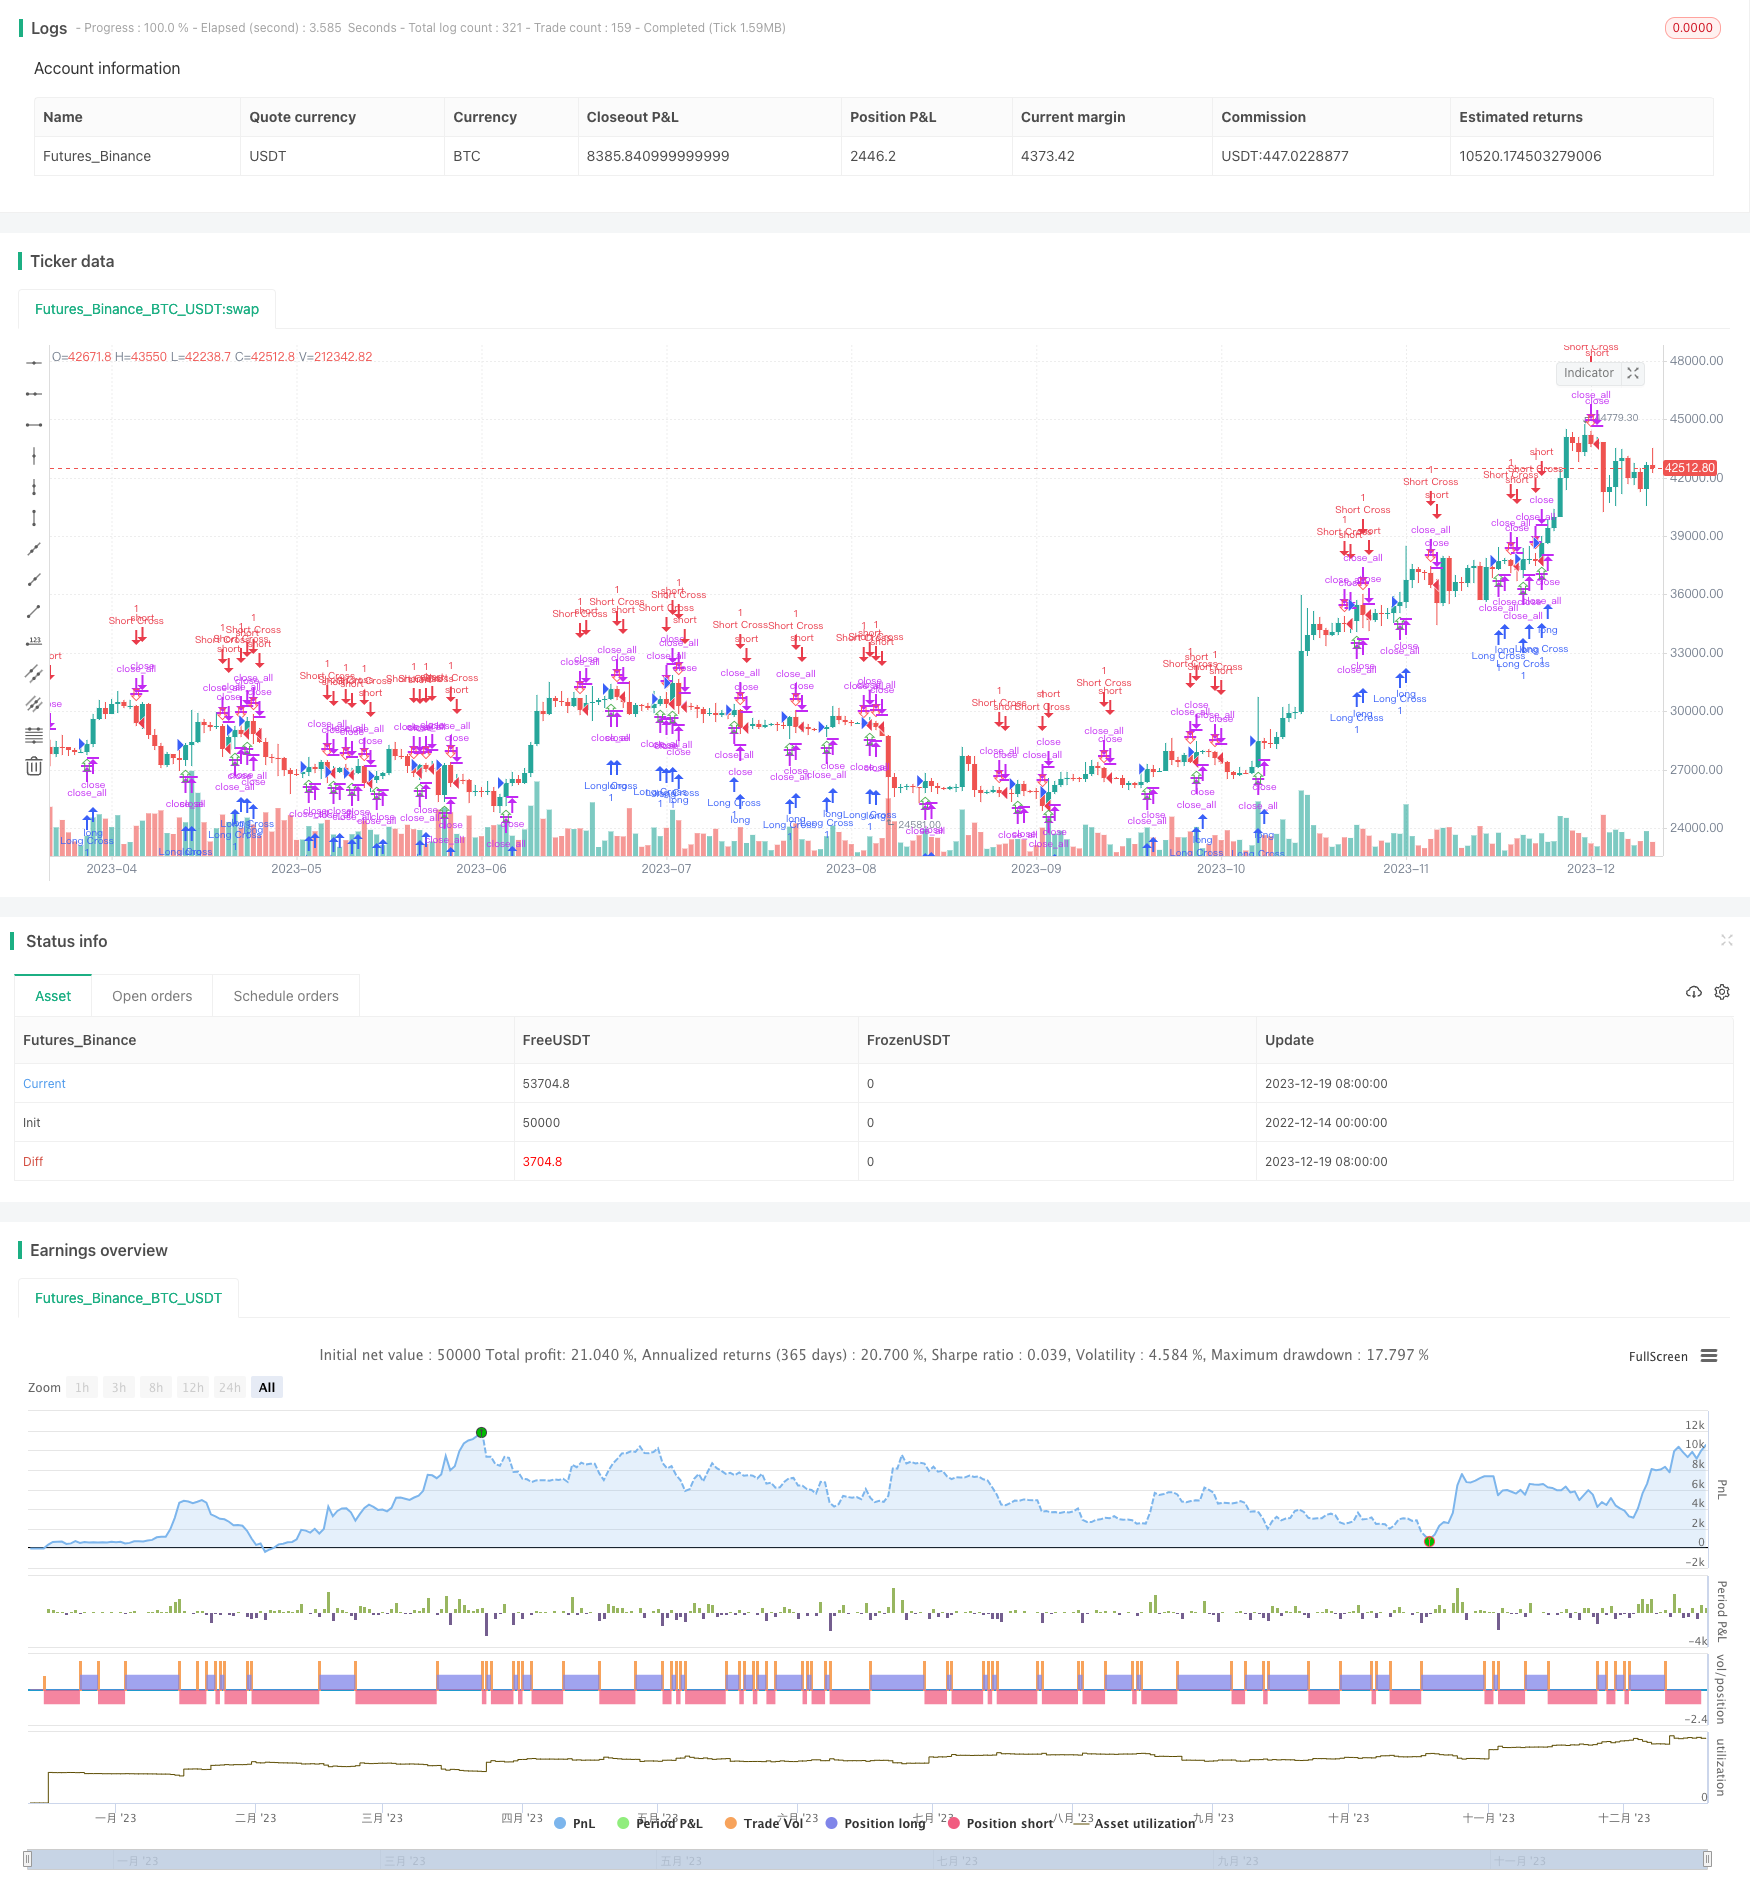
概述
RSI指标与平均线交叉策略是一种结合相对强弱指标(RSI)和移动平均线的量化交易策略。该策略利用RSI指标判断证券价值的超买超卖情况,并结合RSI与其平均线的黄金交叉及死叉信号来决定建立看涨或看跌仓位。
策略原理
计算RSI指标值。RSI指标基于一段时间内的涨跌幅,通过比较平均收盘涨幅和平均收盘跌幅,来判断证券是否超买或超卖。
计算RSI指标的移动平均线MA。采用指数移动平均线EMA或简单移动平均线SMA。
当RSI指标上穿其移动平均线时,产生黄金交叉信号,做多;当RSI指标下穿其移动平均线时,产生死叉信号,做空。
当RSI高于超买线时,认为证券超买,做空;当RSI低于超卖线时,认为证券超卖,做多。
优势分析
结合指标与平均线交叉信号,避免做单只依靠一个指标,提高决策的准确性。
利用RSI指标判断超买超卖的时机,设置超买超卖线,确定建仓和止损的时机。
运用指标与平均线交叉做多做空,可以及时捕捉市场转折点。
风险分析
RSI指标在震荡行情中容易产生错误信号。
RSI超买超卖的判断依据可以调整,设置不当可能导致过于宽松或严格。
均线系统对短期异常波动过于敏感,可能被套住止损。
优化方向
调整RSI参数,寻找最佳长度参数。
优化移动平均线参数,寻找最佳均线周期。
测试不同的超买超卖线参数,优化建仓机会。
结合其他指标过滤信号,避免错误交易。
总结
RSI指标与平均线交叉策略,利用RSI判断超买超卖与移动平均线交叉信号相结合,能够有效判断市场热点区域,在关键点位捕捉反转机会。通过参数优化和信号过滤,可以改进策略表现,减少交易风险。该策略适合中短线交易者,可以提供较好的超额收益。
策略源码
/*backtest
start: 2022-12-14 00:00:00
end: 2023-12-20 00:00:00
period: 1d
basePeriod: 1h
exchanges: [{"eid":"Futures_Binance","currency":"BTC_USDT"}]
*/

//@version=3
//dfurrer45
strategy(title="Relative Strength Index", shorttitle="RSI", overlay=true)
src = close, len = input(13, minval=1, title="Length"), maLen = input(9, minval=1, title="MA Lenght"), exponential = input(false, title="Exponential")

// === BACKTEST RANGE ===
FromMonth = input(defval = 10, title = "From Month", minval = 1)
FromDay   = input(defval = 3, title = "From Day", minval = 1)
FromYear  = input(defval = 2017, title = "From Year", minval = 2014)
ToMonth   = input(defval = 1, title = "To Month", minval = 1)
ToDay     = input(defval = 1, title = "To Day", minval = 1)
ToYear    = input(defval = 9999, title = "To Year", minval = 2014)
// ===  BACKTEST END  ===
backtestdaterange = (time > timestamp(FromYear, FromMonth, FromDay, 00, 00))

rsioverbought = input(90, minval=1, title="RSI % start overbought")
rsioversold = input(10, minval=1, title="RSI % start oversold")
up = rma(max(change(src), 0), len)
down = rma(-min(change(src), 0), len)
rsi = down == 0 ? 100 : up == 0 ? 0 : 100 - (100 / (1 + up / down))
ma = exponential ? ema(rsi, maLen) : sma(rsi, maLen)
rsimacrossup = cross(rsi,ma) and rsi > ma
rsimacrossdown = cross(rsi,ma) and rsi < ma
plotchar(rsimacrossup, char='⇧', location = location.belowbar, color = green, text = "", textcolor = green, size=size.small)
plotchar(rsimacrossdown, char='⇩', location = location.abovebar, color = red, text = "", textcolor = red, size=size.small)
plotchar(rsi > rsioverbought, char='x', location = location.belowbar, color = aqua, text = "", textcolor = red, size=size.small)
plotchar(rsi < rsioversold, char='x', location = location.belowbar, color = aqua, text = "", textcolor = red, size=size.small)


closetrade = rsimacrossup or rsimacrossdown
strategy.close_all(closetrade)
strategy.close_all((rsi > rsioverbought) or (rsi < rsioversold))
strategy.entry("Short Overbought",strategy.short, when=(rsi > rsioverbought) and backtestdaterange)
strategy.entry("Buy Overbought",strategy.long, when=(rsi < rsioversold) and backtestdaterange)
strategy.entry("Long Cross", strategy.long, when=rsimacrossup and backtestdaterange)
strategy.entry("Short Cross", strategy.short, when=rsimacrossdown and backtestdaterange)