Dynamic Weighted Moving Average Trading Strategy
Author: ChaoZhang, Date: 2023-12-21 12:19:43Tags:

Overview
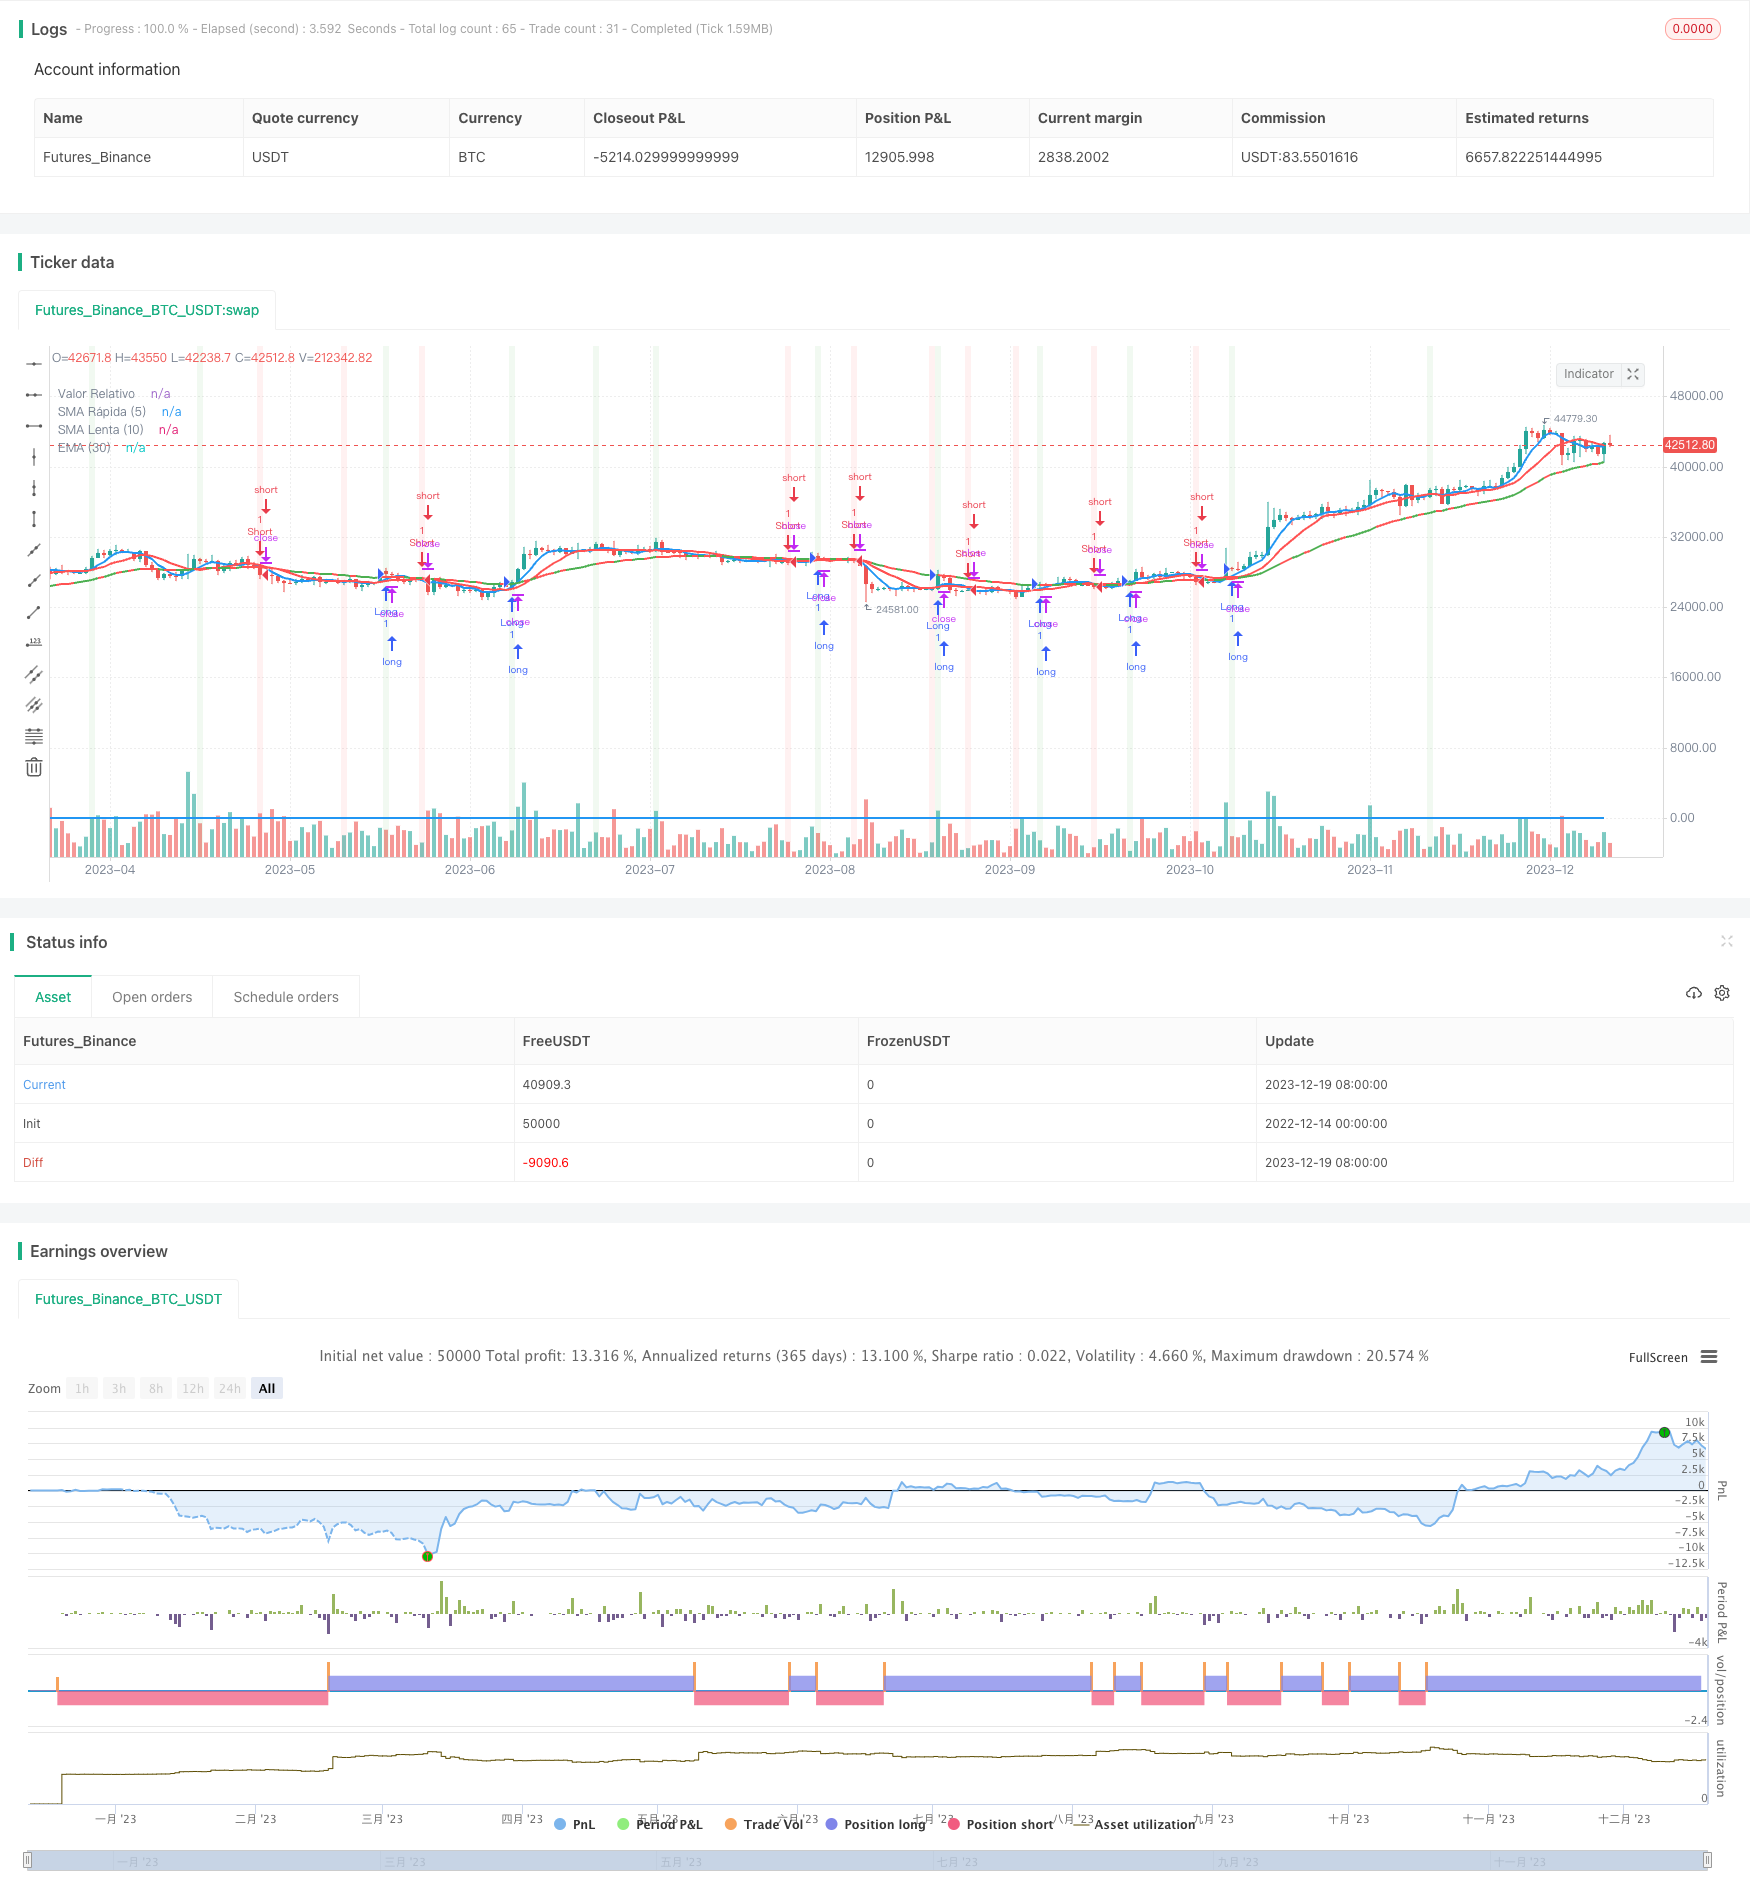
The dynamic weighted moving average trading strategy is designed for highly volatile markets such as cryptocurrencies. It identifies trading signals using fast and slow moving averages and incorporates a dynamic weighting mechanism to improve sensitivity. The strategy also utilizes an EMA filter and color rendering to recognize trend states. The core concept is to capture short-term price moves for excess profits.
Strategy Logic
The strategy consists of boolean variables, indicators and entry logic. The indicators include a 30-day EMA, a 5-day fast SMA and a 10-day slow SMA. The entry logic goes long when the fast SMA crosses above the slow SMA, and goes short on crosses below. An EMA filter is added with the price needing to be above EMA for longs and below for shorts. This takes advantage of the fast SMA’s sensitivity to short-term price changes, while the slow SMA filters out fakeouts. The EMA acts as a trend gauge, collectively forming trading signals.
The color rendering identifies trend by background shading. When the SMAs cross up it recognizes an uptrend, shading the background. Crosses down indicate downtrend and also shade. This intuitively reflects market conditions for easy readability.
Advantage Analysis
The key advantage is strong short-term capture capability. The 5-day fast SMA rapidly catches price moves. The EMA filter eliminates noise. Dynamic SMA weighting also allows more recent prices higher influence, ensuring real-time performance.
Unlike single EMA or SMA strategies, this approach synergizes multiple indicators. Fast and slow SMAs complement signal identification. The EMA provides trend reads. This diversity improves robustness. The color rendering also creates an intuitive interface for clearer trades.
Risks and Mitigations
The main risk is a too-sensitive fast SMA causing excessive fake signals. This can be addressed by raising the SMA period to reduce false triggers.
In choppy conditions the EMA weakens. Additional indicators like BOLL bands could assist trend reads here.
Fat tail events can also generate outsized losses. Stop losses should be implemented to control open risk.
Optimization Suggestions
Possible optimization dimensions include:
-
An adaptive SMA that alters periods based on volatility and trade frequency to improve robustness.
-
Compounding to exponentially grow via a profit target, retaining some gains to compound returns.
-
Machine learning for forecasting, to augment signal judgement with model price change predictions.
Summary
This dynamic weighted moving average approach leverages fast and slow SMAs to capture prices short-term. The EMA filters for trend with color rendering an intuitive interface. Compared to traditional tactics its adaptable design suits crypto’s volatility well. Added risk controls and tuning can achieve consistent income.
/*backtest
start: 2022-12-14 00:00:00
end: 2023-12-20 00:00:00
period: 1d
basePeriod: 1h
exchanges: [{"eid":"Futures_Binance","currency":"BTC_USDT"}]
*/

//@version=5
strategy("Estrategia Mejorada para Criptomonedas", overlay=true)

// Variables de estrategia
var bool longCondition = na
var bool shortCondition = na

// Indicadores
emaValue = ta.ema(close, 30)
smaFast = ta.sma(close, 5)  // Período más corto para mayor sensibilidad
smaSlow = ta.sma(close, 10)  // Período más corto para mayor sensibilidad

// Lógica de la estrategia mejorada
longCondition := ta.crossover(smaFast, smaSlow) and close > emaValue
shortCondition := ta.crossunder(smaFast, smaSlow) and close < emaValue

// Entradas de estrategia
if (longCondition)
    strategy.entry("Long", strategy.long)
if (shortCondition)
    strategy.entry("Short", strategy.short)

// Sombreado para tendencia alcista (verde)
bgcolor(longCondition ? color.new(color.green, 90) : na, title="Tendencia Alcista")

// Sombreado para tendencia bajista (rojo)
bgcolor(shortCondition ? color.new(color.red, 90) : na, title="Tendencia Bajista")

// Otros indicadores o filtros pueden ser agregados aquí

// Visualización de indicadores originales
plotColor = close > open ? color.green : color.red
plot(emaValue, color=plotColor, linewidth=2, title="EMA (30)")
value = 10 * open / close
plotColor2 = close == open ? color.orange : color.blue
plot(value, color=plotColor2, linewidth=2, title="Valor Relativo")

// Visualización de medias móviles
plot(smaFast, color=color.blue, title="SMA Rápida (5)", linewidth=2)
plot(smaSlow, color=color.red, title="SMA Lenta (10)", linewidth=2)
- Moving Average Crossover Strategy with Stop-Loss and Take-Profit
- Mean Reversion Reverse Strategy Based on Moving Average
- Bollinger Bands Based High Frequency Trading Strategy
- A Quantitative Ichimoku Cloud Trading Strategy
- Momentum Strategy Based on Double Bottom Breakout Model
- Stochastic Vortex Strategy
- The Multi-Period Trading Strategy Based on Volatility Index and Stochastic Oscillator
- Extended Adaptive CCI Bottom Fishing Trading Strategy for Commodities
- Momentum Strategy Based on LazyBear's Squeeze
- Floor-Crossing Sawtooth Profit Stop Strategy Based on Moving Average
- Last Candle Strategy
- Quantitative Strategy of Negative Volume Index Reversal
- Triple Supertrend Breakout Strategy
- MACD of Relative Strength Strategy
- Triple Dragon System
- Top Trading Only Based on Weekly EMA8 Strategy
- EMA Pullback Strategy
- Dual Moving Average Trend Tracking Strategy
- Automated Quantitative Trading Strategy Based on Inside Bar and Moving Average
- Trend Trading Strategy Based on Dynamic Moving Average