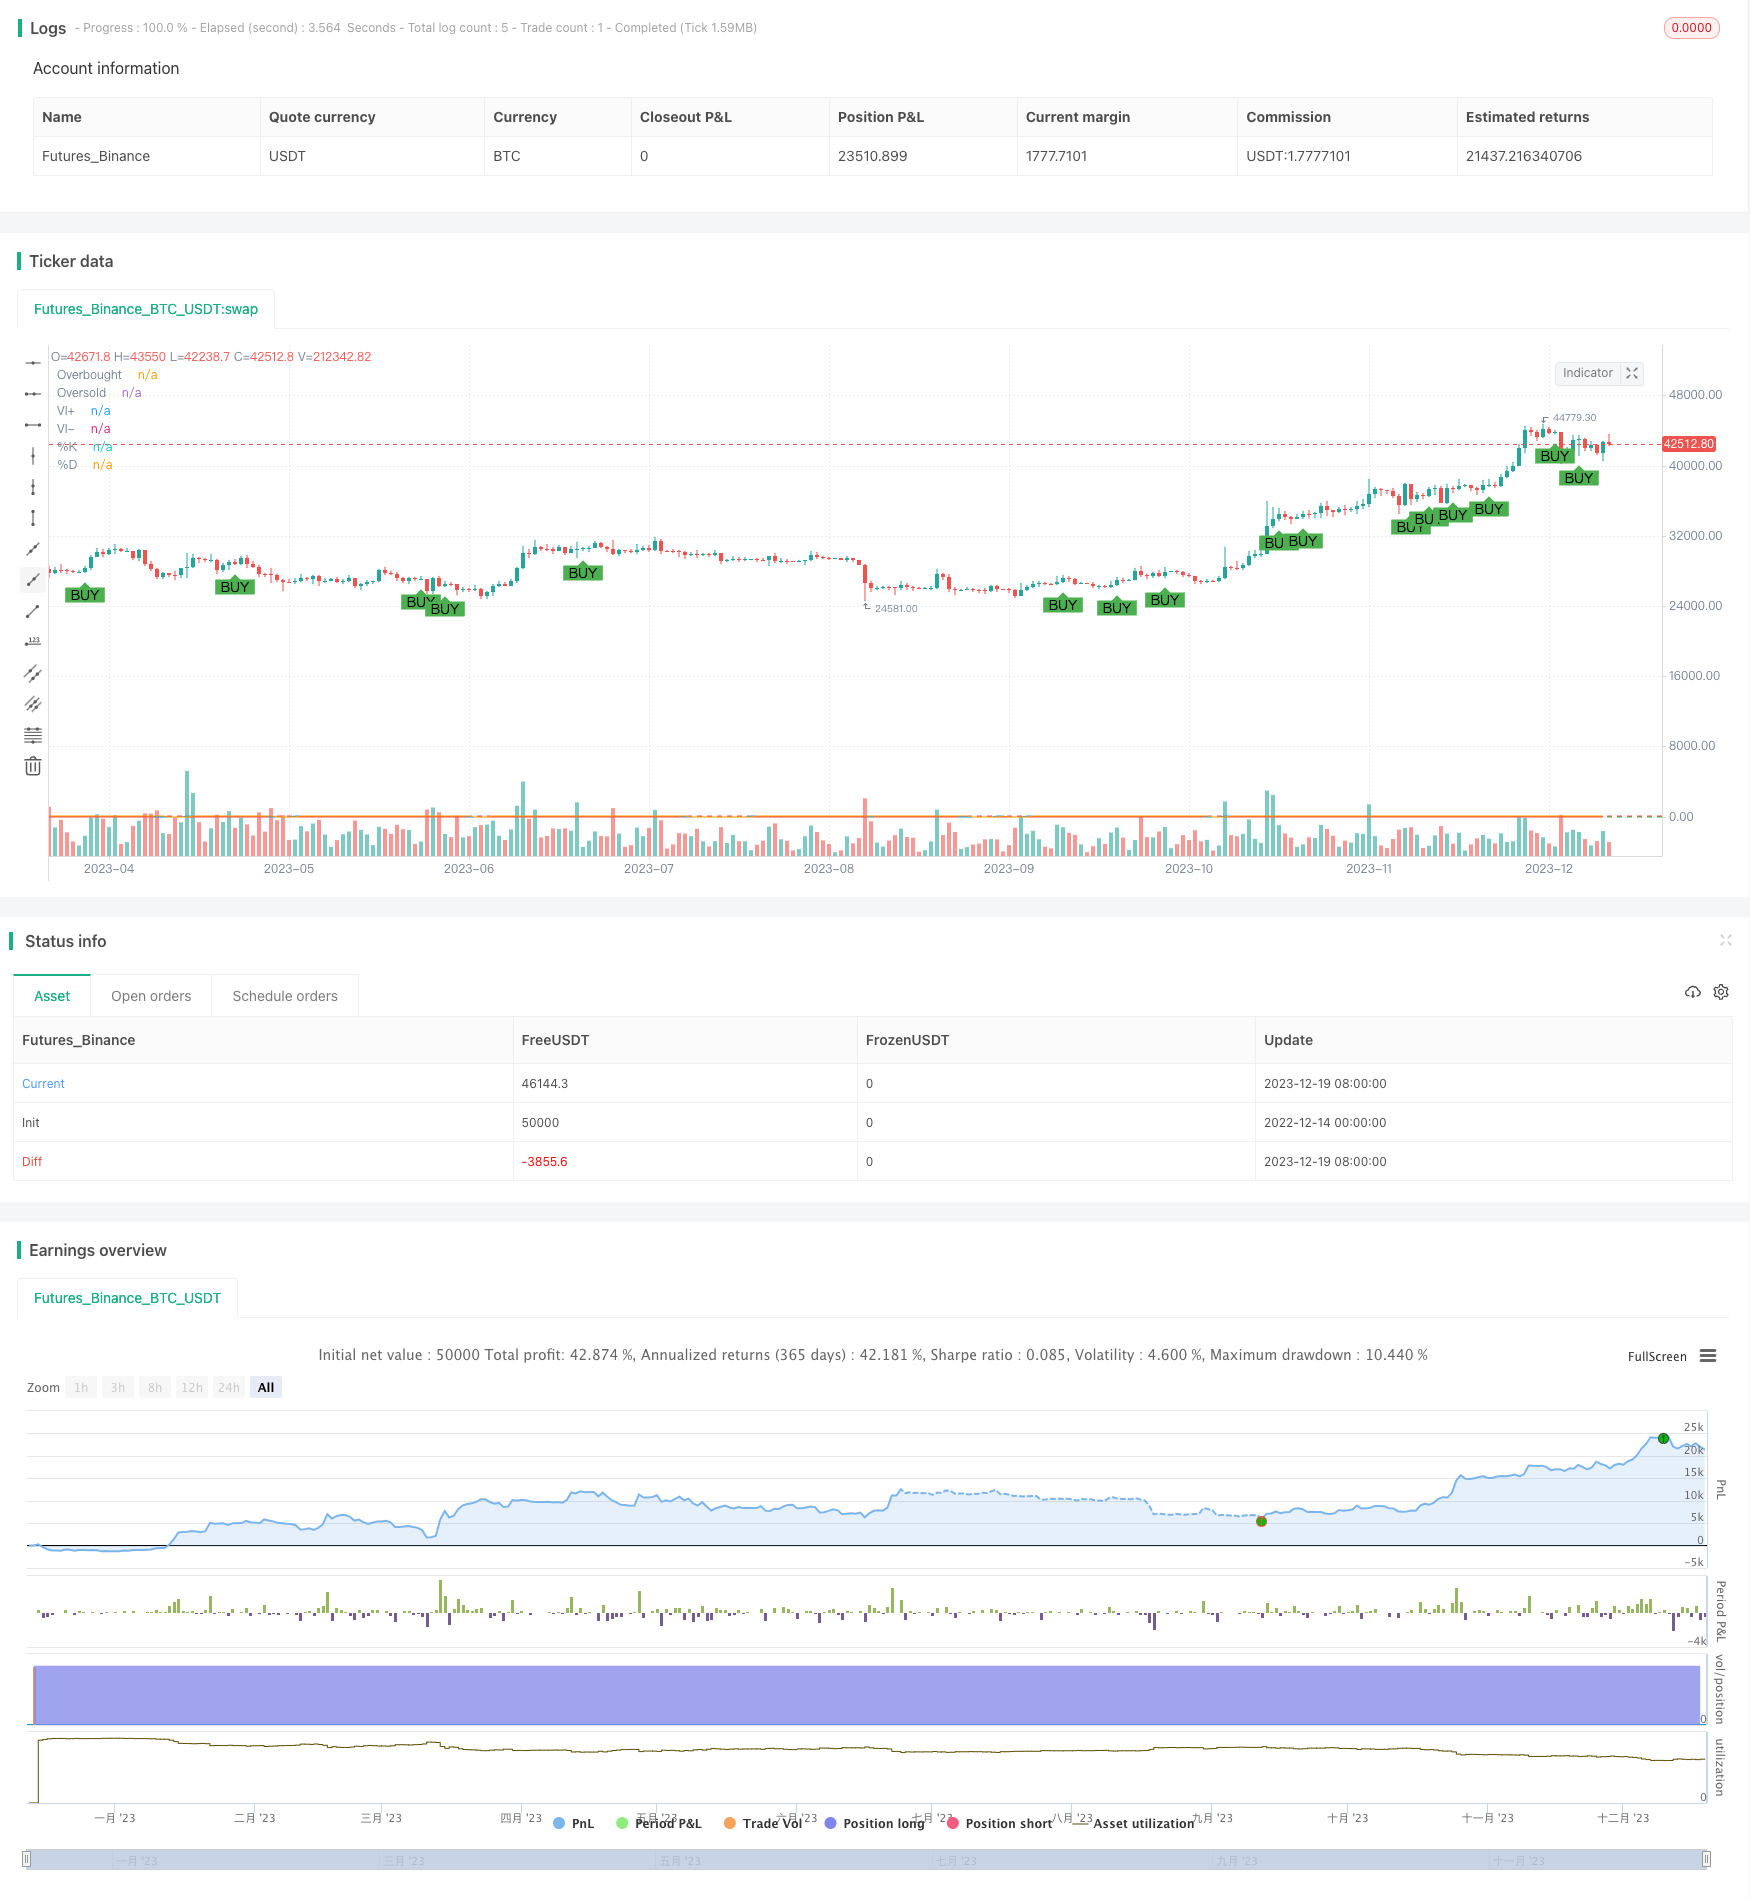
Stochastic Vortex Strategy
Author: ChaoZhang, Date: 2023-12-21 15:12:37Tags:

Overview
The Stochastic Vortex strategy is a strategy that generates buy signals when the K line of the Stochastic Oscillator crosses above the D line and the positive VI is higher than the negative VI. This strategy combines the advantages of the Stochastic Oscillator indicator and the Vortex Indicator to catch opportunities when stock prices reverse.
Strategy Logic
The strategy is mainly based on two indicators:
-
Stochastic Oscillator: This indicator compares the closing price of the day to the highest and lowest prices over a certain period to reflect whether the market is oversold or overbought. When the fast line K of the Stochastic Oscillator crosses above the slow line D, it is considered a buy signal.
-
Vortex Indicator: This indicator reflects the whirlpool-like upward or downward movements in the market by comparing fluctuations over a certain period. When the positive vortex index is higher than the negative vortex index, it means the upward momentum of the stock price is stronger than the downward momentum, so we can buy.
The buy signal of this strategy comes from the fast line K crossing above the slow line D of the Stochastic Oscillator, indicating the stock price rebounds from the oversold area. And the positive vortex index higher than the negative vortex index means strong upward momentum of the stock price. So the combination of these two signals generates the final buy decision.
Advantage Analysis
The main features of this strategy are:
-
Catch the rebound of stock prices in a timely manner. The K line crossing above the D line reflects the price reversal.
-
The Vortex Index determines the upward momentum to avoid false breakouts.
-
Adjustable parameters to optimize the strategy.
-
Visualized buy signal for intuitive judgement.
-
The stochastic and vortex have built-in mechanisms without too much historical data. Suitable for live trading.
Risk Analysis
There are some risks in this strategy:
-
Buy signals may have errors and losses cannot be completely avoided.
-
Inappropriate parameter settings may affect strategy performance.
-
The probability of indicator failure is greater when stock prices fluctuate sharply.
-
It cannot determine market trends and will also generate buy signals in bear markets.
These risks can be mitigated by adjusting parameters, setting stop loss, considering market trends, etc. But no quantitative strategies can completely avoid losses. Certain risks need to be taken.
Optimization
The strategy can also be optimized in the following aspects:
-
Combine other technical indicators to determine overall trend to avoid opening positions at high levels.
-
Increase stop loss mechanisms to control maximum single loss.
-
Test different combinations of indicator parameters to find the optimal parameters.
-
Increase opening conditions to reduce false positive probabilities.
-
Consider trading costs and set minimum profit targets.
These optimizations can improve the stability of strategies, reduce losses, and maximize the value of strategies.
Summary
The Stochastic Vortex Strategy takes into account the price reversal signals and upward momentum signals. It is a typical reversal strategy. It seizes opportunities when stock prices rebound from oversold areas and uses the Vortex Index to determine upward momentum to avoid false breakouts. This flexible, easy-to-implement strategy has controllable risks and is a good quantitative strategy. But no strategy can completely avoid market risk. We should treat it cautiously and pay attention to possible optimization spaces to discover greater value of the strategy.
/*backtest
start: 2022-12-14 00:00:00
end: 2023-12-20 00:00:00
period: 1d
basePeriod: 1h
exchanges: [{"eid":"Futures_Binance","currency":"BTC_USDT"}]
*/

//@version=4
strategy("Stochastic and Vortex Strategy", overlay=true)

// Stochastic Oscillator settings
kPeriod = input(14, title="K Period")
dPeriod = input(3, title="D Period")
slowing = input(3, title="Slowing")
k = sma(stoch(close, high, low, kPeriod), slowing)
d = sma(k, dPeriod)

// Vortex Indicator settings
lengthVI = input(14, title="Vortex Length")
tr = max(max(high - low, abs(high - close[1])), abs(low - close[1]))
vmPlus = abs(high - low[1])
vmMinus = abs(low - high[1])
viPlus = sum(vmPlus, lengthVI) / sum(tr, lengthVI)
viMinus = sum(vmMinus, lengthVI) / sum(tr, lengthVI)

// Buy condition
buyCondition = crossover(k, d) and viPlus > viMinus

if (buyCondition)
    strategy.entry("Buy", strategy.long)

plotshape(series=buyCondition, title="Buy Signal", location=location.belowbar, color=color.green, style=shape.labelup, text="BUY")
plot(k, title="%K", color=color.blue)
plot(d, title="%D", color=color.orange)
hline(80, "Overbought", color=color.red)
hline(20, "Oversold", color=color.green)
plot(viPlus, title="VI+", color=color.purple)
plot(viMinus, title="VI-", color=color.red)
- Moment Reversal Strategy Based on Multi-factor Model
- Short-term Trading Strategy Based on Chaikin Volatility Indicator
- Dual MA Crossover Trend Tracking Strategy
- Super Trend Triple Strategy
- Dynamic Trailing Stop Loss Strategy
- Moving Average Crossover Strategy with Stop-Loss and Take-Profit
- Mean Reversion Reverse Strategy Based on Moving Average
- Bollinger Bands Based High Frequency Trading Strategy
- A Quantitative Ichimoku Cloud Trading Strategy
- Momentum Strategy Based on Double Bottom Breakout Model
- The Multi-Period Trading Strategy Based on Volatility Index and Stochastic Oscillator
- Extended Adaptive CCI Bottom Fishing Trading Strategy for Commodities
- Momentum Strategy Based on LazyBear's Squeeze
- Floor-Crossing Sawtooth Profit Stop Strategy Based on Moving Average
- Dynamic Weighted Moving Average Trading Strategy
- Last Candle Strategy
- Quantitative Strategy of Negative Volume Index Reversal
- Triple Supertrend Breakout Strategy
- MACD of Relative Strength Strategy
- Triple Dragon System