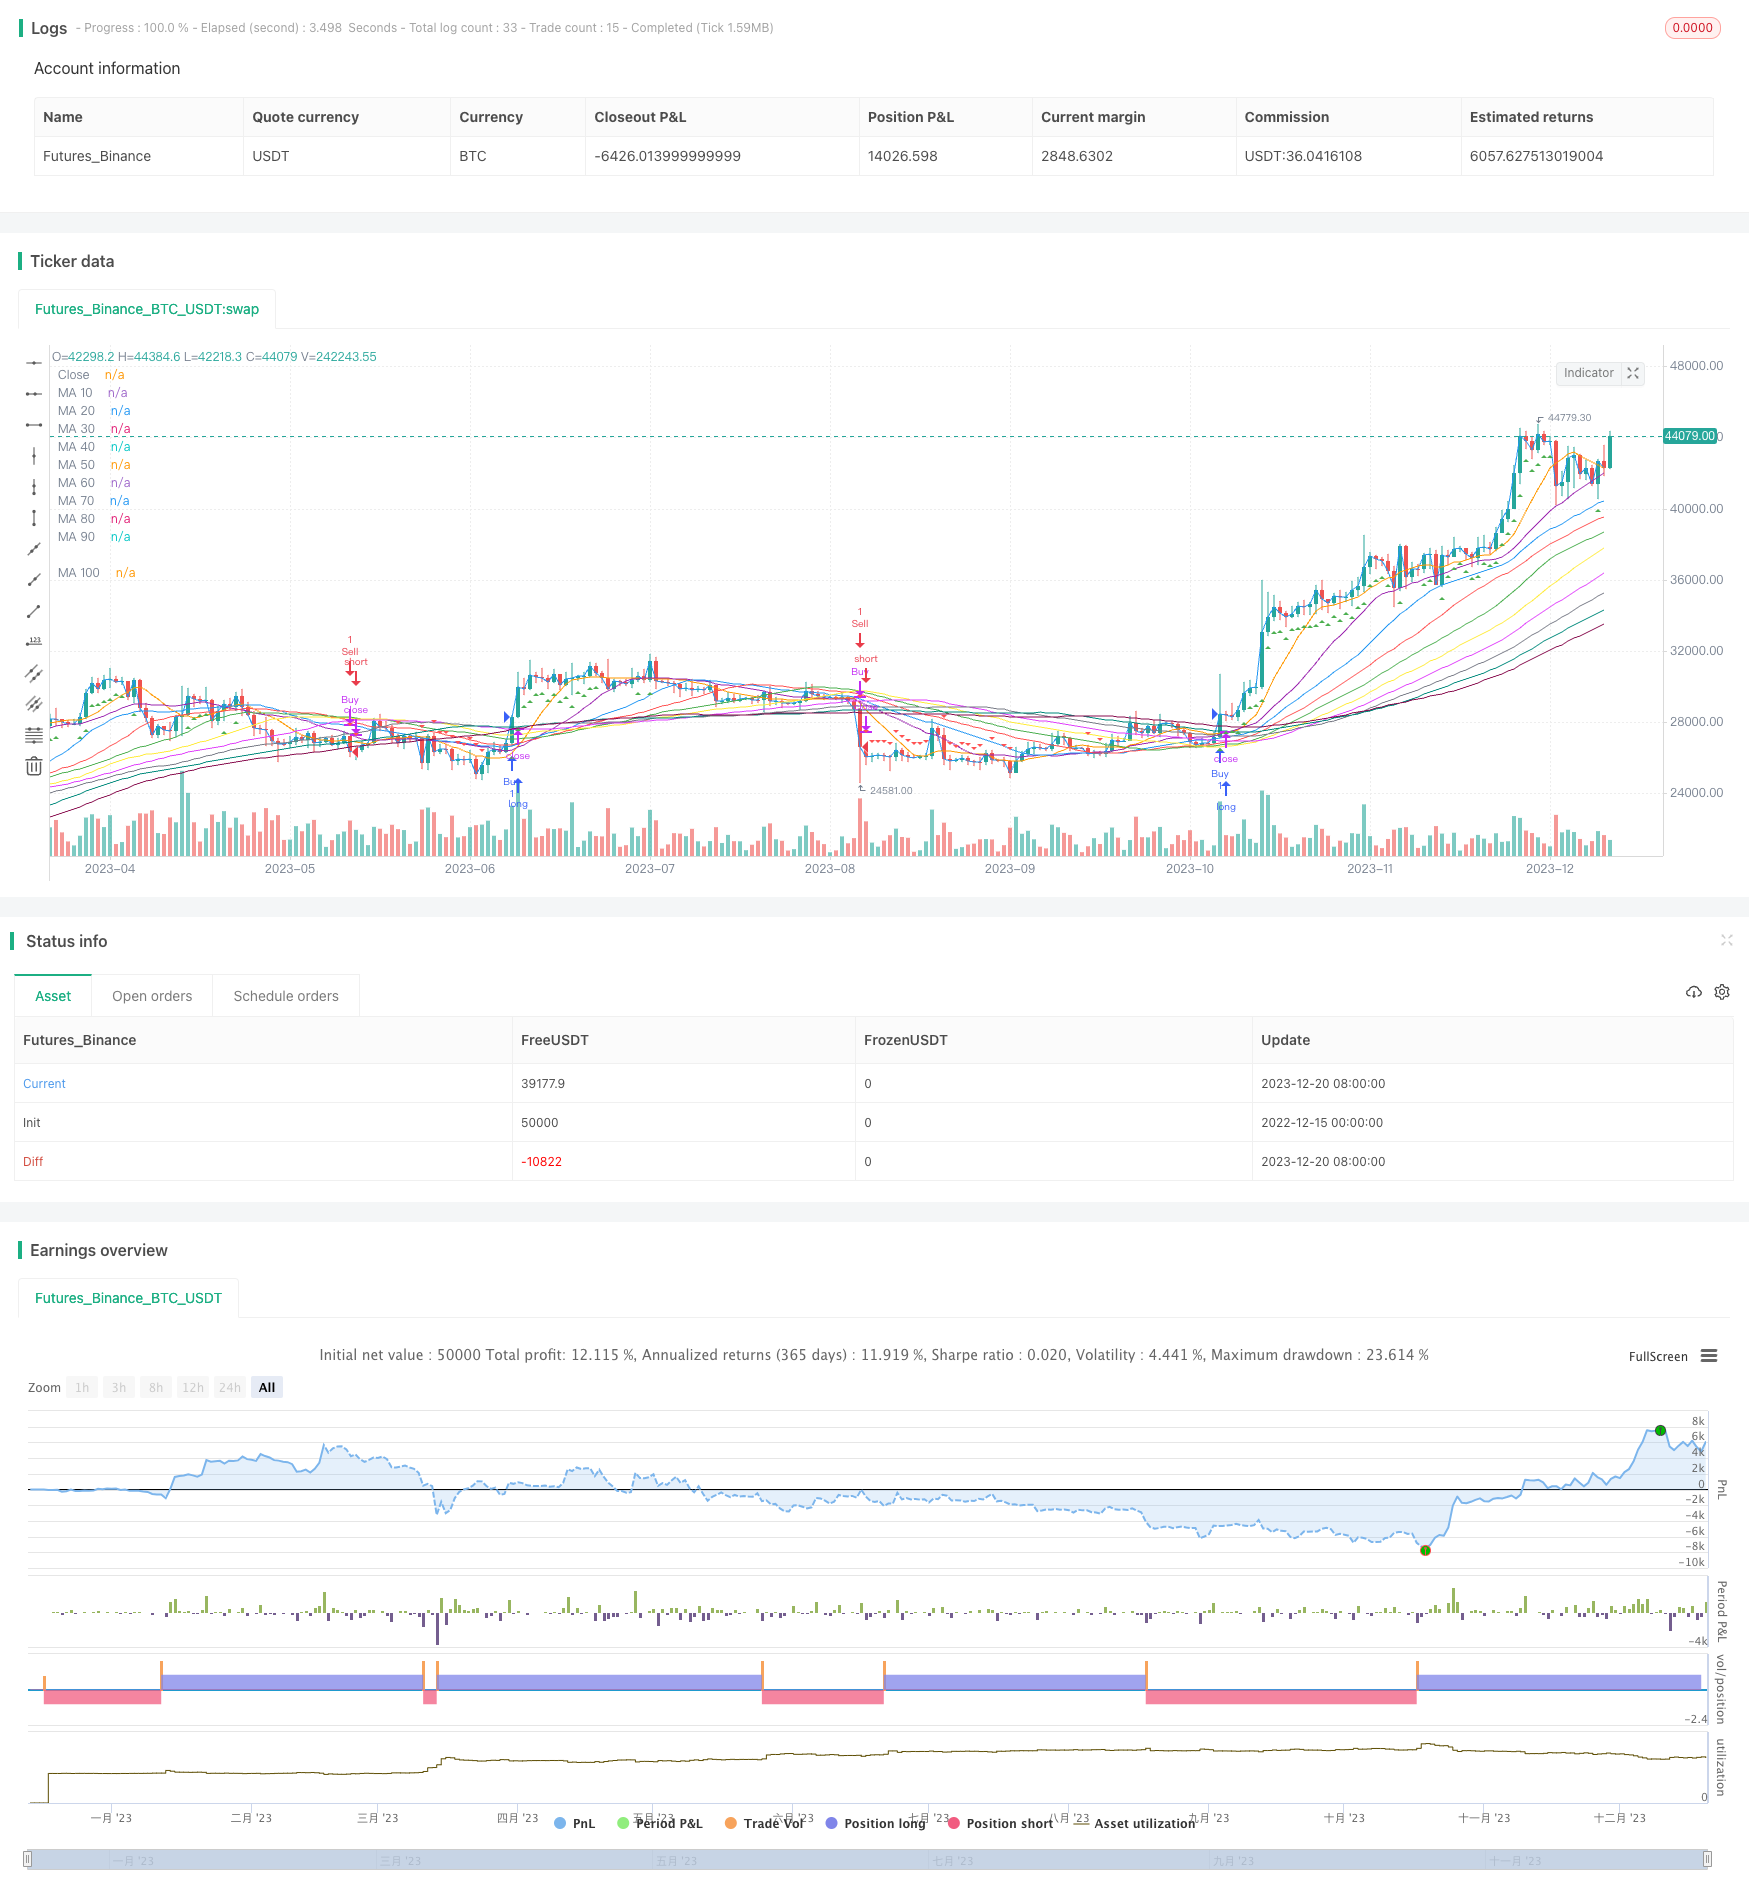
Overview
The Multiple Moving Average Comprehensive Strategy is a very versatile and powerful technical analysis strategy. It combines multiple moving averages across different timeframes to provide comprehensive insights into market trends. The strategy generates clear buy and sell signals to identify potential entry and exit points. It also offers great customizability to allow users to adjust moving average lengths based on their trading preferences and objectives.
Principles
The core of this strategy is to compute and track multiple moving averages across different periods, specifically the 10-day, 20-day, 30-day up till 100-day moving averages. These moving averages are set to be the average closing price over the past 10, 20, 30 days etc. For example, the 20-day moving average is the average closing price over the past 20 days.
When today’s closing price is above all these moving averages, a buy signal is generated. When today’s closing price is below all these moving averages, a sell signal is generated. Thus, signals are only triggered when all the moving averages across different timeframes point in the same direction. This filters out a lot of noise and makes the signals more reliable.
Advantages
Provides insights across multiple timescales, adaptable to different market environments
Filters out noise via multiple confirmations, making signals more reliable
Clear trading rules easy to understand and implement
Highly customizable to meet personalized requirements
Provides guidance for entries, stop losses and take profits, facilitating risk management
Risks and Solutions
Multiple moving averages may cross during ranging markets, leading to unclear signals. This can be reduced by adjusting number and lengths of moving averages.
Probability of future price breaking multiple moving averages is low, potentially missing some trades. Number of moving averages can be reduced to lower breakout difficulty.
Signals are lagging, unable to capture trend reversals early. Incorporating leading indicators like MACD can improve turn point judgement.
Number of trades generated may be low for consistent income. Shortening moving average lengths or combining with other strategies/indicators can help.
Optimization Directions
Parameter Tuning: Adjust number and lengths of moving averages to find optimal parameter mix. 5-, 10- and 20-day combinations could be tested for example.
Combining Other Indicators: Adding indicators like MACD and RSI can improve strategy resilience. Different indicators provide complementarity.
Strategy Ensemble: Ensemble with other strategies like breakout systems and trend tracking can enhance robustness. Different strategies diversify risks.
Automated Optimization: Algorithmically test different parameter sets to maximize objective functions and find optimal parameters. Reduces manual interference and improves efficiency.
Conclusion
The Multiple Moving Average Comprehensive Strategy is a very versatile and powerful analytical tool. It provides multi-timescale insights, reliable signals, ease of use and understandability, and high customizability. At the same time, it has some limitations which can be addressed via parameter tuning, model combinations etc for adaptation to more complex market regimes. The strategy can serve as both a learning tool to aid technical analysis skill development as well as practical trading implementation after adjustments tailored to individual needs.
/*backtest
start: 2022-12-15 00:00:00
end: 2023-12-21 00:00:00
period: 1d
basePeriod: 1h
exchanges: [{"eid":"Futures_Binance","currency":"BTC_USDT"}]
*/

//@version=5
strategy("Multiple Moving Average Strategy", overlay=true)

// Function to calculate moving average
get_ma(src, length) =>
    ta.sma(src, length)

// Initialize moving average lengths
ma_length_10 = 10
ma_length_20 = 20
ma_length_30 = 30
ma_length_40 = 40
ma_length_50 = 50
ma_length_60 = 60
ma_length_70 = 70
ma_length_80 = 80
ma_length_90 = 90
ma_length_100 = 100

// Calculate 10-day, 20-day, 30-day, 40-day, 50-day, 60-day, 70-day, 80-day, 90-day, and 100-day moving averages
ma_10 = get_ma(close, ma_length_10)
ma_20 = get_ma(close, ma_length_20)
ma_30 = get_ma(close, ma_length_30)
ma_40 = get_ma(close, ma_length_40)
ma_50 = get_ma(close, ma_length_50)
ma_60 = get_ma(close, ma_length_60)
ma_70 = get_ma(close, ma_length_70)
ma_80 = get_ma(close, ma_length_80)
ma_90 = get_ma(close, ma_length_90)
ma_100 = get_ma(close, ma_length_100)

// Generate Buy/Sell signals for the 10 moving averages
buy_signal = close > ma_10
sell_signal = close < ma_10

// Add conditions for each additional moving average length
buy_signal := buy_signal and (close > get_ma(close, ma_length_20))
sell_signal := sell_signal and (close < get_ma(close, ma_length_20))

buy_signal := buy_signal and (close > get_ma(close, ma_length_30))
sell_signal := sell_signal and (close < get_ma(close, ma_length_30))

buy_signal := buy_signal and (close > get_ma(close, ma_length_40))
sell_signal := sell_signal and (close < get_ma(close, ma_length_40))

buy_signal := buy_signal and (close > get_ma(close, ma_length_50))
sell_signal := sell_signal and (close < get_ma(close, ma_length_50))

buy_signal := buy_signal and (close > get_ma(close, ma_length_60))
sell_signal := sell_signal and (close < get_ma(close, ma_length_60))

buy_signal := buy_signal and (close > get_ma(close, ma_length_70))
sell_signal := sell_signal and (close < get_ma(close, ma_length_70))

buy_signal := buy_signal and (close > get_ma(close, ma_length_80))
sell_signal := sell_signal and (close < get_ma(close, ma_length_80))

buy_signal := buy_signal and (close > get_ma(close, ma_length_90))
sell_signal := sell_signal and (close < get_ma(close, ma_length_90))

buy_signal := buy_signal and (close > get_ma(close, ma_length_100))
sell_signal := sell_signal and (close < get_ma(close, ma_length_100))

// Plot Buy/Sell signals on the chart
plotshape(buy_signal, title="Buy Signal", color=color.green, style=shape.triangleup, location=location.belowbar)
plotshape(sell_signal, title="Sell Signal", color=color.red, style=shape.triangledown, location=location.abovebar)

// Execute long buy order when all ten moving averages give a Buy signal
if (buy_signal)
    strategy.entry("Buy", strategy.long)

// Execute sell order when all ten moving averages give a Sell signal
if (sell_signal)
    strategy.close("Buy")

// Execute short sell order when all ten moving averages give a Sell signal
if (sell_signal)
    strategy.entry("Sell", strategy.short)

// Execute buy order when all ten moving averages give a Buy signal
if (buy_signal)
    strategy.close("Sell")

// Plot closing price and moving averages on the chart
plot(close, title="Close", color=color.blue)
plot(ma_10, title="MA 10", color=color.orange)
plot(ma_20, title="MA 20", color=color.purple)
plot(ma_30, title="MA 30", color=color.blue)
plot(ma_40, title="MA 40", color=color.red)
plot(ma_50, title="MA 50", color=color.green)
plot(ma_60, title="MA 60", color=color.yellow)
plot(ma_70, title="MA 70", color=color.fuchsia)
plot(ma_80, title="MA 80", color=color.gray)
plot(ma_90, title="MA 90", color=color.teal)
plot(ma_100, title="MA 100", color=color.maroon)