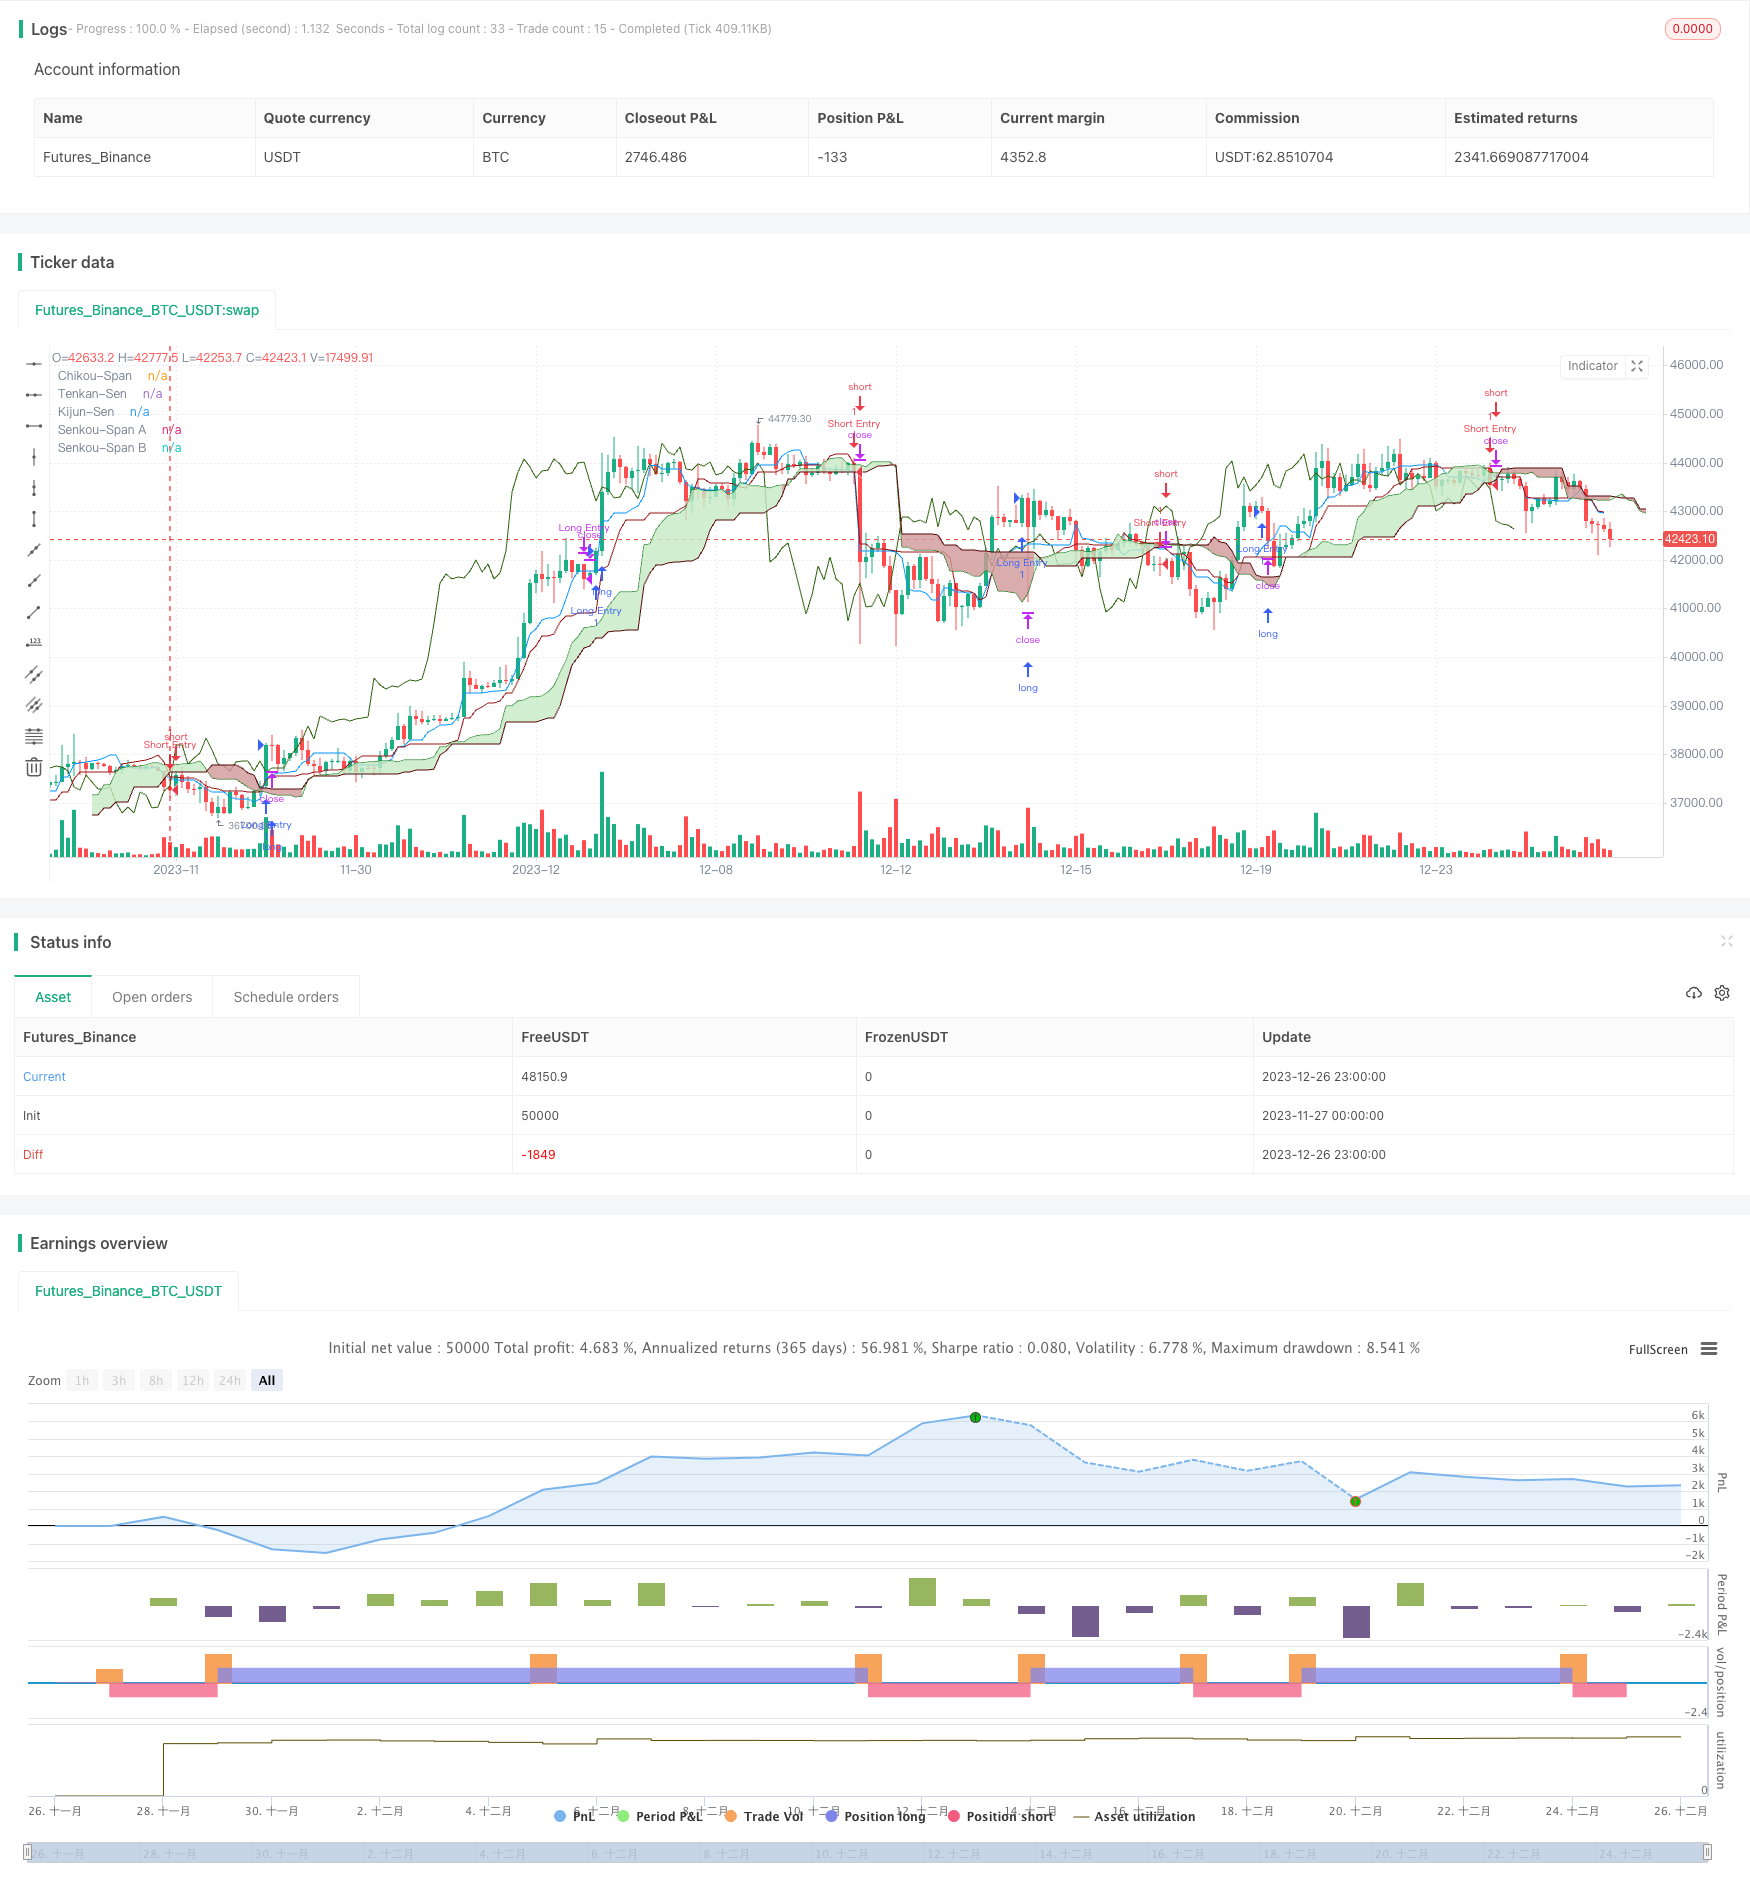
Overview
This strategy is an improvement based on the Ichimoku trading system. The main idea is to combine the Ichimoku indicator and money management rules to identify short and long trading opportunities.
Strategy Principles
The strategy uses the classic Ichimoku system as a basic reference. The main components include:
Tenkan-Sen: Conversion Line. Reflecting medium-term trends.
Kijun-Sen: Base Line. Reflecting long-term trends.
Senkou Span: Leading Line. Reflecting future trends.
Chikou Span: Lagging Line. Reflecting past trends.
On this basis, the strategy has made the following improvements:
The time parameters follow the odd square theory to better match the market patterns.
Money management rules are added, including stop loss, take profit, position sizing etc, to control trading risks.
Backtesting period adjustable for more comprehensive testing.
Specifically, long entry conditions include tenkan cross kijun up, chikou above price, price above kumo, future kumo bullish etc. Short entry requires tenkan cross kijun down, chikou below price etc.
Money management rules require 30% profit taking and 5% stop loss for longs; stop loss if more than 3 ATR from tenkan for shorts.
Advantage Analysis
The main advantages of combining Ichimoku and money management are:
Ichimoku itself reflects short, medium and long term trends, reasonable entry/exits.
Odd square theory optimizes parameters to match market statistics.
Money management effectively controls single trade stop loss while profits exceed.
Adjustable backtesting period enables more comprehensive testing.
In summary, this strategy comprehensively considers trend, parameter selection, risk control etc, and is effective in identifying short-long opportunities and controlling trading risks, with strong practicality.
Risk Analysis
The main risks of this strategy come from:
Ichimoku is prone to false breakouts causing unnecessary entries. More filters needed.
Fixed profit taking and stop loss can be vulnerable to traps. Dynamic rules required.
Incomprehensive backtesting data may overestimate performance. Longer testing across more markets needed.
The strategy fits trending markets more. May underperform in ranging markets. Entry conditions can be optimized for trend identification.
Enhancement Directions
The main areas of enhancements include:
Add indicator filters to improve entry quality. Such as MACD, KDJ etc.
Dynamic profit taking and stop loss. For example, profit taking after N ATR breakouts, stop loss below supports.
Multi-asset testing across longer data for stability verification.
Differentiate trending and ranging markets. Optimize entries for adaptation to varying market conditions.
Conclusion
This strategy comprehensively considers trend, money management etc, uses Ichimoku to identify long opportunities, and applies risk control rules to limit single trade loss. Significant improvements over the original Ichimoku system. Further optimizations can potentially make it a very practical short-long strategy.
/*backtest
start: 2023-11-27 00:00:00
end: 2023-12-27 00:00:00
period: 3h
basePeriod: 15m
exchanges: [{"eid":"Futures_Binance","currency":"BTC_USDT"}]
*/

// Author Obarut
//@version=5
strategy("İchimoku Strategy With MM Short-Long",overlay=true,process_orders_on_close=true)

//Ichimoku Inputs
ts_period = input.int(8, minval=1, title="Tenkan-Sen Period")
ks_period = input.int(16, minval=1, title="Kijun-Sen Period")
ssb_period = input.int(24, minval=1, title="Senkou-Span B Period")
cs_offset = input.int(16, minval=1, title="Chikou-Span Offset")
ss_offset = input.int(8, minval=1, title="Senkou-Span Offset")
long_entry = input(true, title="Long Entry")
short_entry = input(true, title="Short Entry")

// Back Testing Period Inputs

fromday = input.int(defval=1,title="Start Date",minval=1,maxval=31)
frommonth = input.int(defval=1,title="Start Month",minval=1,maxval=12)
fromyear = input.int(defval=1980,title="Start Year",minval=1800, maxval=2100)
today = input.int(defval=1,title="En Date",minval=1,maxval=31)
tomonth = input.int(defval=1,title="End Month",minval=1,maxval=12)
toyear =input.int(defval=2100,title="End Year",minval=1800,maxval=2200)
start=timestamp(fromyear,frommonth,fromday,00,00)
finish=timestamp(toyear,tomonth,today,00,00)
timewindow= time>=start and time<=finish

//Ichimoku Componenets Calculation Function
middle(len) => math.avg(ta.lowest(len), ta.highest(len))

// Ichimoku Components

tenkan = middle(ts_period)
kijun = middle(ks_period)
senkouA = math.avg(tenkan, kijun)
senkouB = middle(ssb_period)
//Senkou Span Lines slopes
slopetenkan=(tenkan-tenkan[2])/tenkan
slopekijun= (kijun-kijun[2])/kijun
//Avarage True Range
atr = ta.atr(14)
//Senkou Span Lines
ss_above = math.max(senkouA[ss_offset-1], senkouB[ss_offset-1])
ss_below = math.min(senkouA[ss_offset-1], senkouB[ss_offset-1])

// Price Distance From Tenkan
distance = close - tenkan

// Price Distance from Kijun
distancek = close - kijun

// Entry/Exit Signals

tk_cross_kijun_bull = tenkan >= kijun//Tenkan Sen is greater than or equal to  Kijun Sen
tk_cross_kijun_bear = tenkan <= kijun//Tenkan Sen is smaller than or equal to Kijun Sen
cs_cross_bull = close > high[cs_offset-1]//Chikou is above the price
cs_cross_bear = close < close[cs_offset-1]//Chikou is below the price
price_above_kumo = close > ss_above//Price is above the Kumo cloud
pbsenkA = close < ss_above // Price is below the Senkou Span which is higher
pasenkB = close > ss_below// Price is above the Senkou span which is lower
price_below_kumo = close < ss_below // Price is below Kumo cloud
future_kumo_bull = senkouA > senkouB and (ta.roc(senkouA,3)>0) and (ta.roc(senkouB,3)>=0) // Future Kumo cloud is bullish
pbtenkan=close<tenkan
tkbelowkij=tenkan<kijun
future_kumo_bear = senkouA < senkouB//Future Kumo cloud is bearish
// Price Distance From Tenken
disbull = distance < 2*atr
//Price Distance From Kijun
disbullk = distancek < 3*atr
//Price Above Tenkan Condition
patk = close > tenkan
// Kijun Above Senkou Span Condition
kjasenkA = kijun > ss_above
// Price Below Kijun Condition
pbkijun = close < kijun
//Consolidation Tenkan and Kijun are inside Kumo cloud
kijuninsidekumo= kijun<ss_above and kijun>ss_below
tenkaninsidekumo= tenkan<ss_above and tenkan>ss_below
consolidation=kijuninsidekumo and tenkaninsidekumo

//Bullish Entry Condition

bullish= tk_cross_kijun_bull and cs_cross_bull and price_above_kumo and future_kumo_bull and disbull and patk
     and not consolidation
//Bullish exit
bearish=tk_cross_kijun_bear and pbsenkA and cs_cross_bear  and future_kumo_bear
      or price_below_kumo
// Bearish Entry Condition

bearish2=tk_cross_kijun_bear and pbtenkan and tkbelowkij and tkbelowkij and cs_cross_bear and future_kumo_bear

if(bullish and timewindow and long_entry )
    strategy.entry("Long Entry", strategy.long)


if(bearish2 and timewindow and short_entry)
    strategy.entry("Short Entry",strategy.short)
// Bearish Condition


lastentryprice = strategy.opentrades.entry_price(strategy.opentrades - 1)

// Take Profit or Stop Loss in Bearish

exit1= (close-tenkan)>3*atr and slopetenkan<=0
exit2= (close-lastentryprice)>5*atr and close<(tenkan-0.04*atr)

if(bearish and timewindow and not short_entry or exit1 or exit2  or (close>1.30*lastentryprice  ) or (close< 0.95*lastentryprice))
    strategy.close("Long Entry")
if(bullish and timewindow and not long_entry)
    strategy.close("Short Entry")
if(time>finish)
    strategy.close_all("time up")

plot(tenkan, color=#0496ff, title="Tenkan-Sen")
plot(kijun, color=#991515, title="Kijun-Sen")
plot(close, offset=-cs_offset+1, color=#2e640e, title="Chikou-Span")
sa=plot(senkouA, offset=ss_offset-1, color=color.rgb(17, 122, 21), title="Senkou-Span A")
sb=plot(senkouB, offset=ss_offset-1, color=color.rgb(88, 8, 8), title="Senkou-Span B")
fill(sa, sb, color = senkouA > senkouB ? color.rgb(198, 234, 198) : color.rgb(208, 153, 153), title="Cloud color")