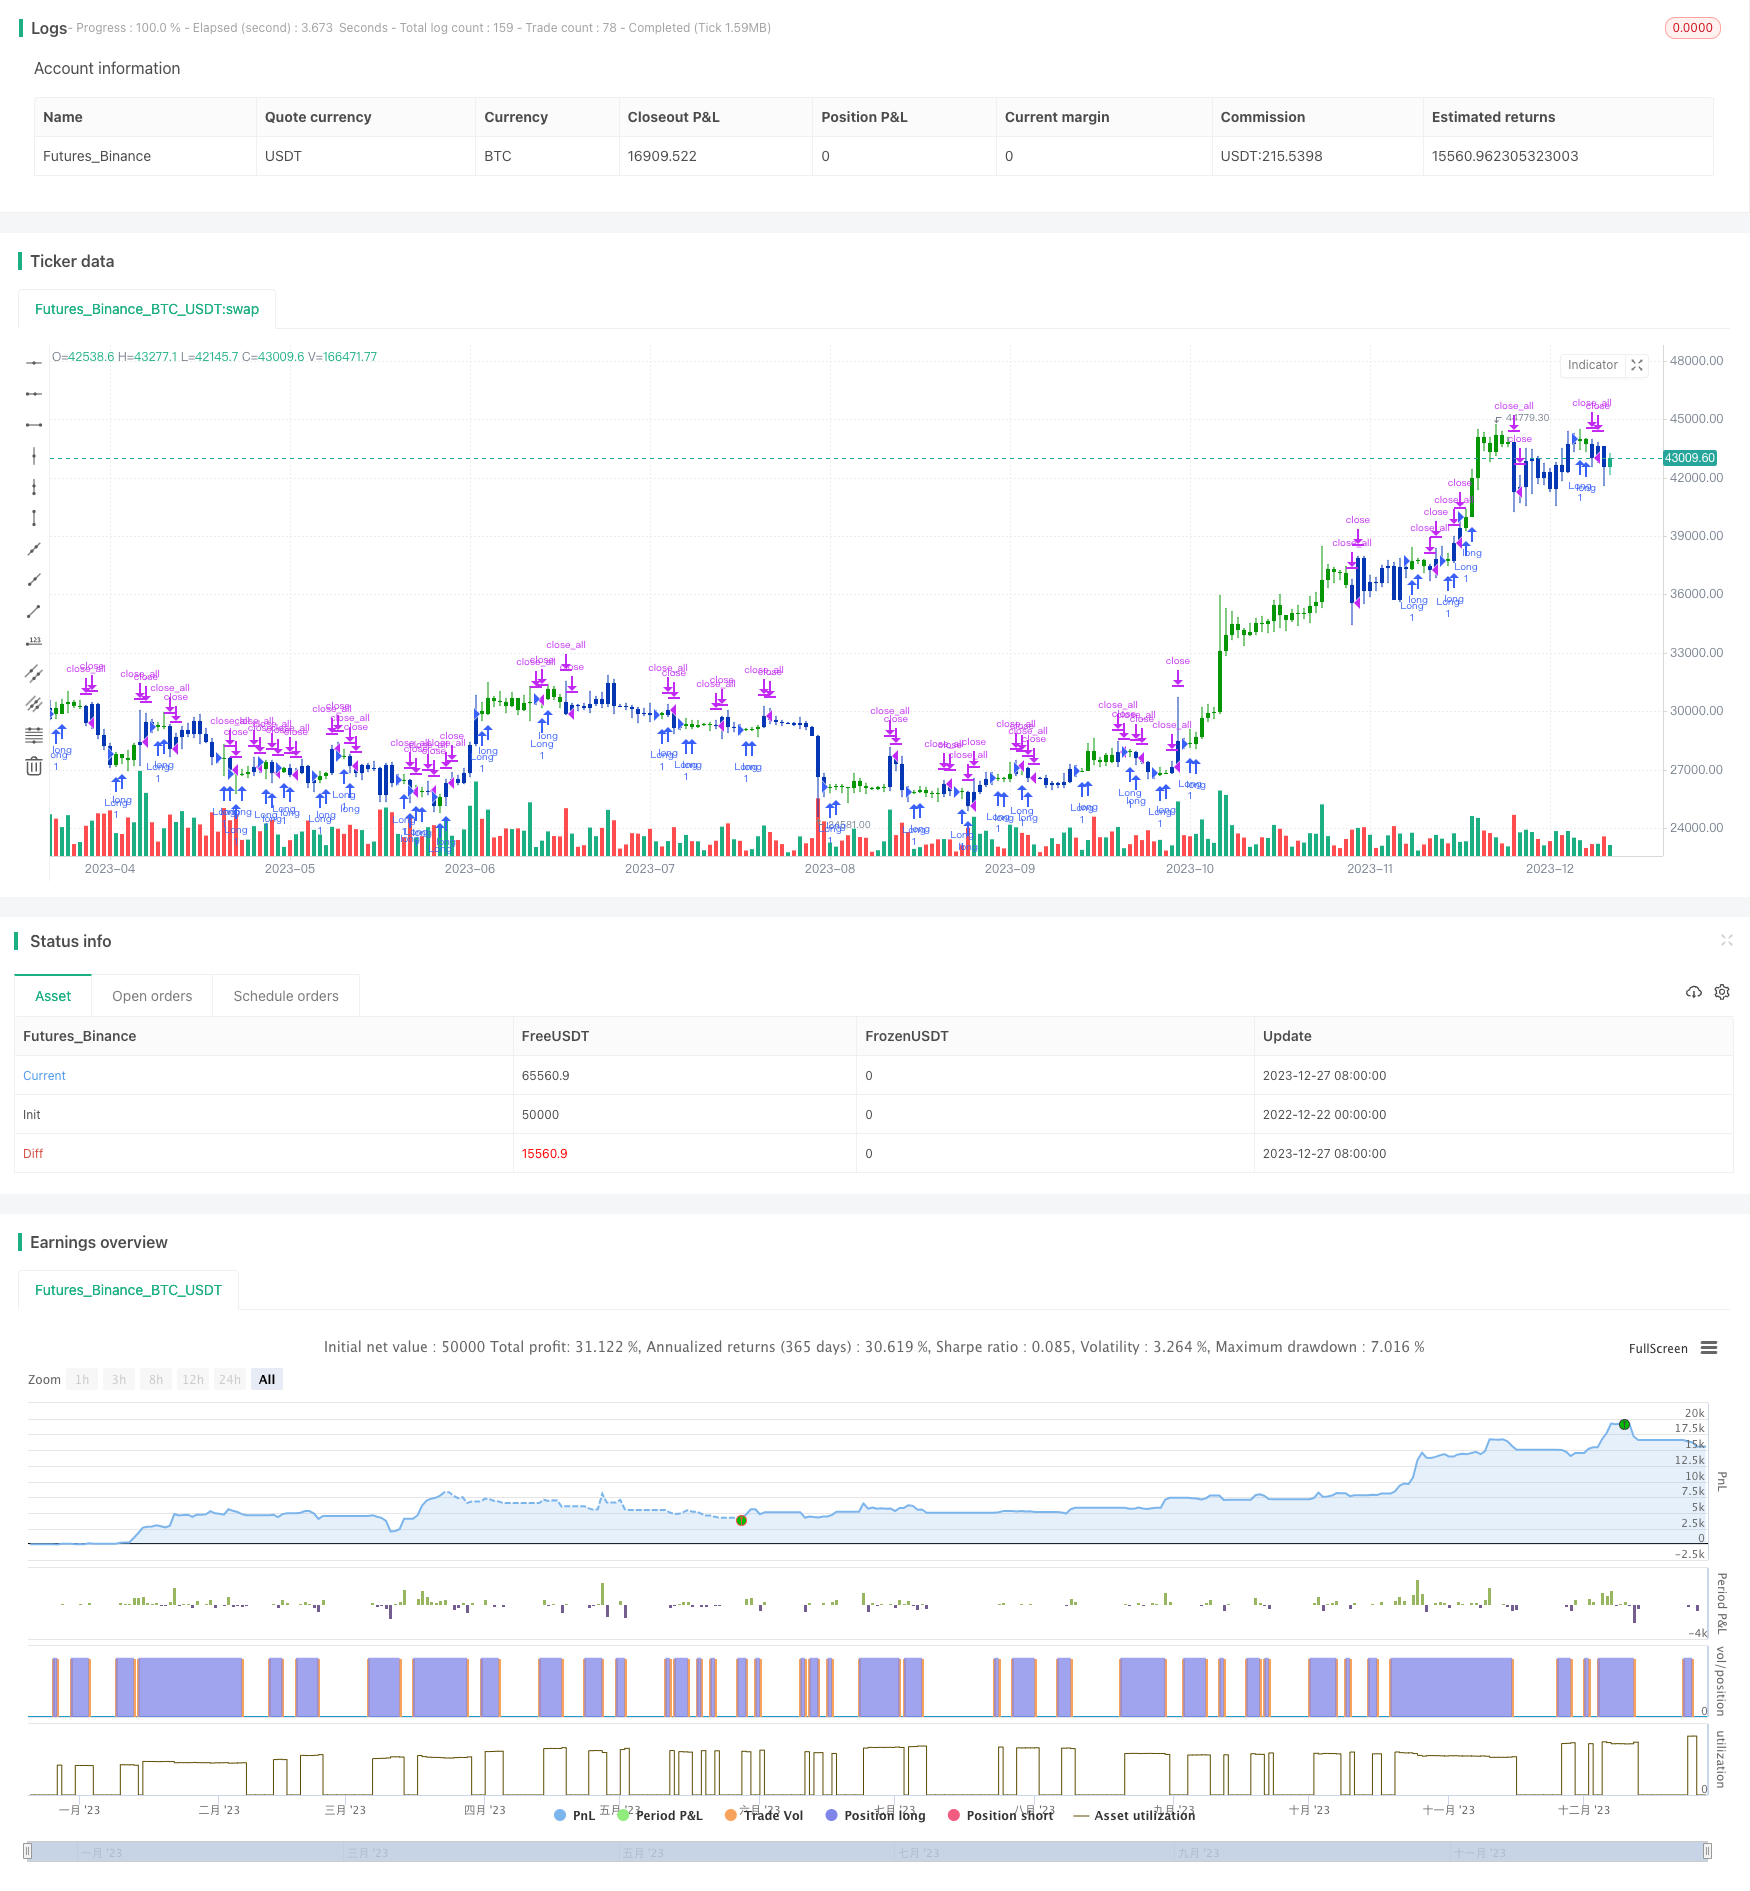
Quantitative Dual-indicator Strategy
Author: ChaoZhang, Date: 2023-12-29 16:29:21Tags:

Overview
This strategy is a combination strategy based on dual EMA indicator and Bull Power indicator. The strategy name contains keywords like “quantitative” and “dual-indicator”, highlighting its characteristic of using two independent indicators.
Strategy Logic
The strategy consists of two parts:
2⁄20 EMA indicator. This indicator calculates the 2-day and 20-day EMA. It generates buy signals when price crosses above EMA and sell signals when price crosses below EMA.
Bull Power indicator. This indicator calculates bullish/bearish power based on the current bar’s relationship with previous bar. It generates trading signals when bull/bear power exceeds the threshold.
The two parts’ signals need to trigger at the same time to open positions. For example, EMA golden cross and Bull Power being positive open long positions, while EMA dead cross and Bull Power being negative open short positions.
Advantage Analysis
- Combine indicators to filter fake signals. Single indicator is prone to be influenced by external factors generating fake signals. Dual-indicator combination can verify each other and filter out fake signals, improving signal quality.
- Customizable parameters. The periods of EMA and threshold of Bull Power are customizable to adapt to different market environments.
- Simple and clear logic. The strategy only uses two common indicators with simple and clear logic, easy to understand and implement.
Risk Analysis
- Indicator failure risk. Despite using combinational indicators, extreme market conditions may still cause indicator failure.
- Parameter optimization risk. Inappropriate parameter settings may lead to insufficient or excessive trading, undermining strategy performance. Requires sufficient testing to find optimal parameters.
Optimization Directions
- Add stop loss mechanisms. Set moving or lookback stop loss to control single trade loss.
- Optimize parameter settings. Test different parameter combinations to find the optimal parameters for better performance.
- Add filtering conditions. Adding conditions like trading volumes or volatility to filter abnormal market conditions when opening positions.
Conclusion
The strategy realizes trading decisions by combining dual EMA and Bull Power indicators. Compared to single indicator strategies, the combination eliminates fake signals effectively while retaining customizable parameters. In conclusion, this strategy features simplicity, flexibility and strong practicality as a quantitative trading strategy.
/*backtest
start: 2022-12-22 00:00:00
end: 2023-12-28 00:00:00
period: 1d
basePeriod: 1h
exchanges: [{"eid":"Futures_Binance","currency":"BTC_USDT"}]
*/

//@version=5
////////////////////////////////////////////////////////////
//  Copyright by HPotter v1.0 12/07/2022
// This is combo strategies for get a cumulative signal.
//
// First strategy
// This indicator plots 2/20 exponential moving average. For the Mov
// Avg X 2/20 Indicator, the EMA bar will be painted when the Alert criteria is met.
//
// Second strategy
//  Bull Power Indicator
//  To get more information please see "Bull And Bear Balance Indicator"
//  by Vadim Gimelfarb.
//
// WARNING:
// - For purpose educate only
// - This script to change bars colors.
////////////////////////////////////////////////////////////
EMA20(Length) =>
    pos = 0.0
    xPrice = close
    xXA = ta.ema(xPrice, Length)
    nHH = math.max(high, high[1])
    nLL = math.min(low, low[1])
    nXS = nLL > xXA or nHH < xXA ? nLL : nHH
    iff_1 = nXS < close[1] ? 1 : nz(pos[1], 0)
    pos := nXS > close[1] ? -1 : iff_1
    pos


BP(SellLevel) =>
    pos = 0.0
    value = close < open ?
             close[1] < open ?  math.max(high - close[1], close - low): math.max(high - open, close - low):
              close > open ?
               close[1] > open ?  high - low : math.max(open - close[1], high - low) :
                 high - close > close - low ?
                  close[1] < open ? math.max(high - close[1], close - low) : high - open :
                   high - close < close - low ?
                     close[1] > open ?  high - low : math.max(open - close, high - low) :
                      close[1] > open ? math.max(high - open, close - low) :
                       close[1] < open? math.max(open - close, high - low): high - low
    val2 = ta.sma(value, 15)
    pos :=  val2 > SellLevel ? 1 : -1
    pos

strategy(title='Combo 2/20 EMA & Bull Power', shorttitle='Combo', overlay=true)
var I1 = '●═════ 2/20 EMA ═════●'
Length = input.int(14, minval=1, group=I1)
var I2 = '●═════  Bull Power ═════●'
SellLevel = input.float(-15, step=0.01, group=I2)
var misc = '●═════ MISC ═════●'
reverse = input.bool(false, title='Trade reverse', group=misc)
var timePeriodHeader = '●═════ Time Start ═════●'
d = input.int(1, title='From Day', minval=1, maxval=31, group=timePeriodHeader)
m = input.int(1, title='From Month', minval=1, maxval=12, group=timePeriodHeader)
y = input.int(2005, title='From Year', minval=0, group=timePeriodHeader)
StartTrade = time > timestamp(y, m, d, 00, 00) ? true : false
posEMA20 = EMA20(Length)
prePosBP = BP(SellLevel)
iff_1 = posEMA20 == -1 and prePosBP == -1 and StartTrade ? -1 : 0
pos = posEMA20 == 1 and prePosBP == 1 and StartTrade ? 1 : iff_1
iff_2 = reverse and pos == -1 ? 1 : pos
possig = reverse and pos == 1 ? -1 : iff_2
if possig == 1
    strategy.entry('Long', strategy.long)
if possig == -1
    strategy.entry('Short', strategy.short)
if possig == 0
    strategy.close_all()
barcolor(possig == -1 ? #b50404 : possig == 1 ? #079605 : #0536b3)
- BankNifty Supertrend Trading Strategy
- Transient Zones Strategy
- Trailing Stop Loss Dual Moving Average Strategy
- Multi Timeframe Momentum Breakout Strategy
- Pivot Point Golden Ratio Buy High Sell Low Strategy
- Turtle Trading Strategy Based on Simple Moving Average
- Dual Moving Average Bollinger Band MACD Trading Strategy
- Bollinger Bands and RSI Crossover Strategy
- Trend Following Strategy Based on QQE and MA
- Volume Weighted Average Price Strategy
- Momentum Tracking Strategy
- RSI Indicator Improvement Trading Strategy
- Trend Reversal Momentum Indicators Crossover Tracking Strategy
- Multi Timeframe Breakout Strategy
- Momentum and Money Flow Crossroad Cashing Strategy
- Dynamic Take Profit Following Trend Strategy
- 10EMA Double Cross Trend Tracking Strategy
- Dynamic Pivot Point Backtest Strategy
- Dual EMA Crossover Trend Strategy
- Anchored Rolling CVDVWAP Signal Strategy