概述
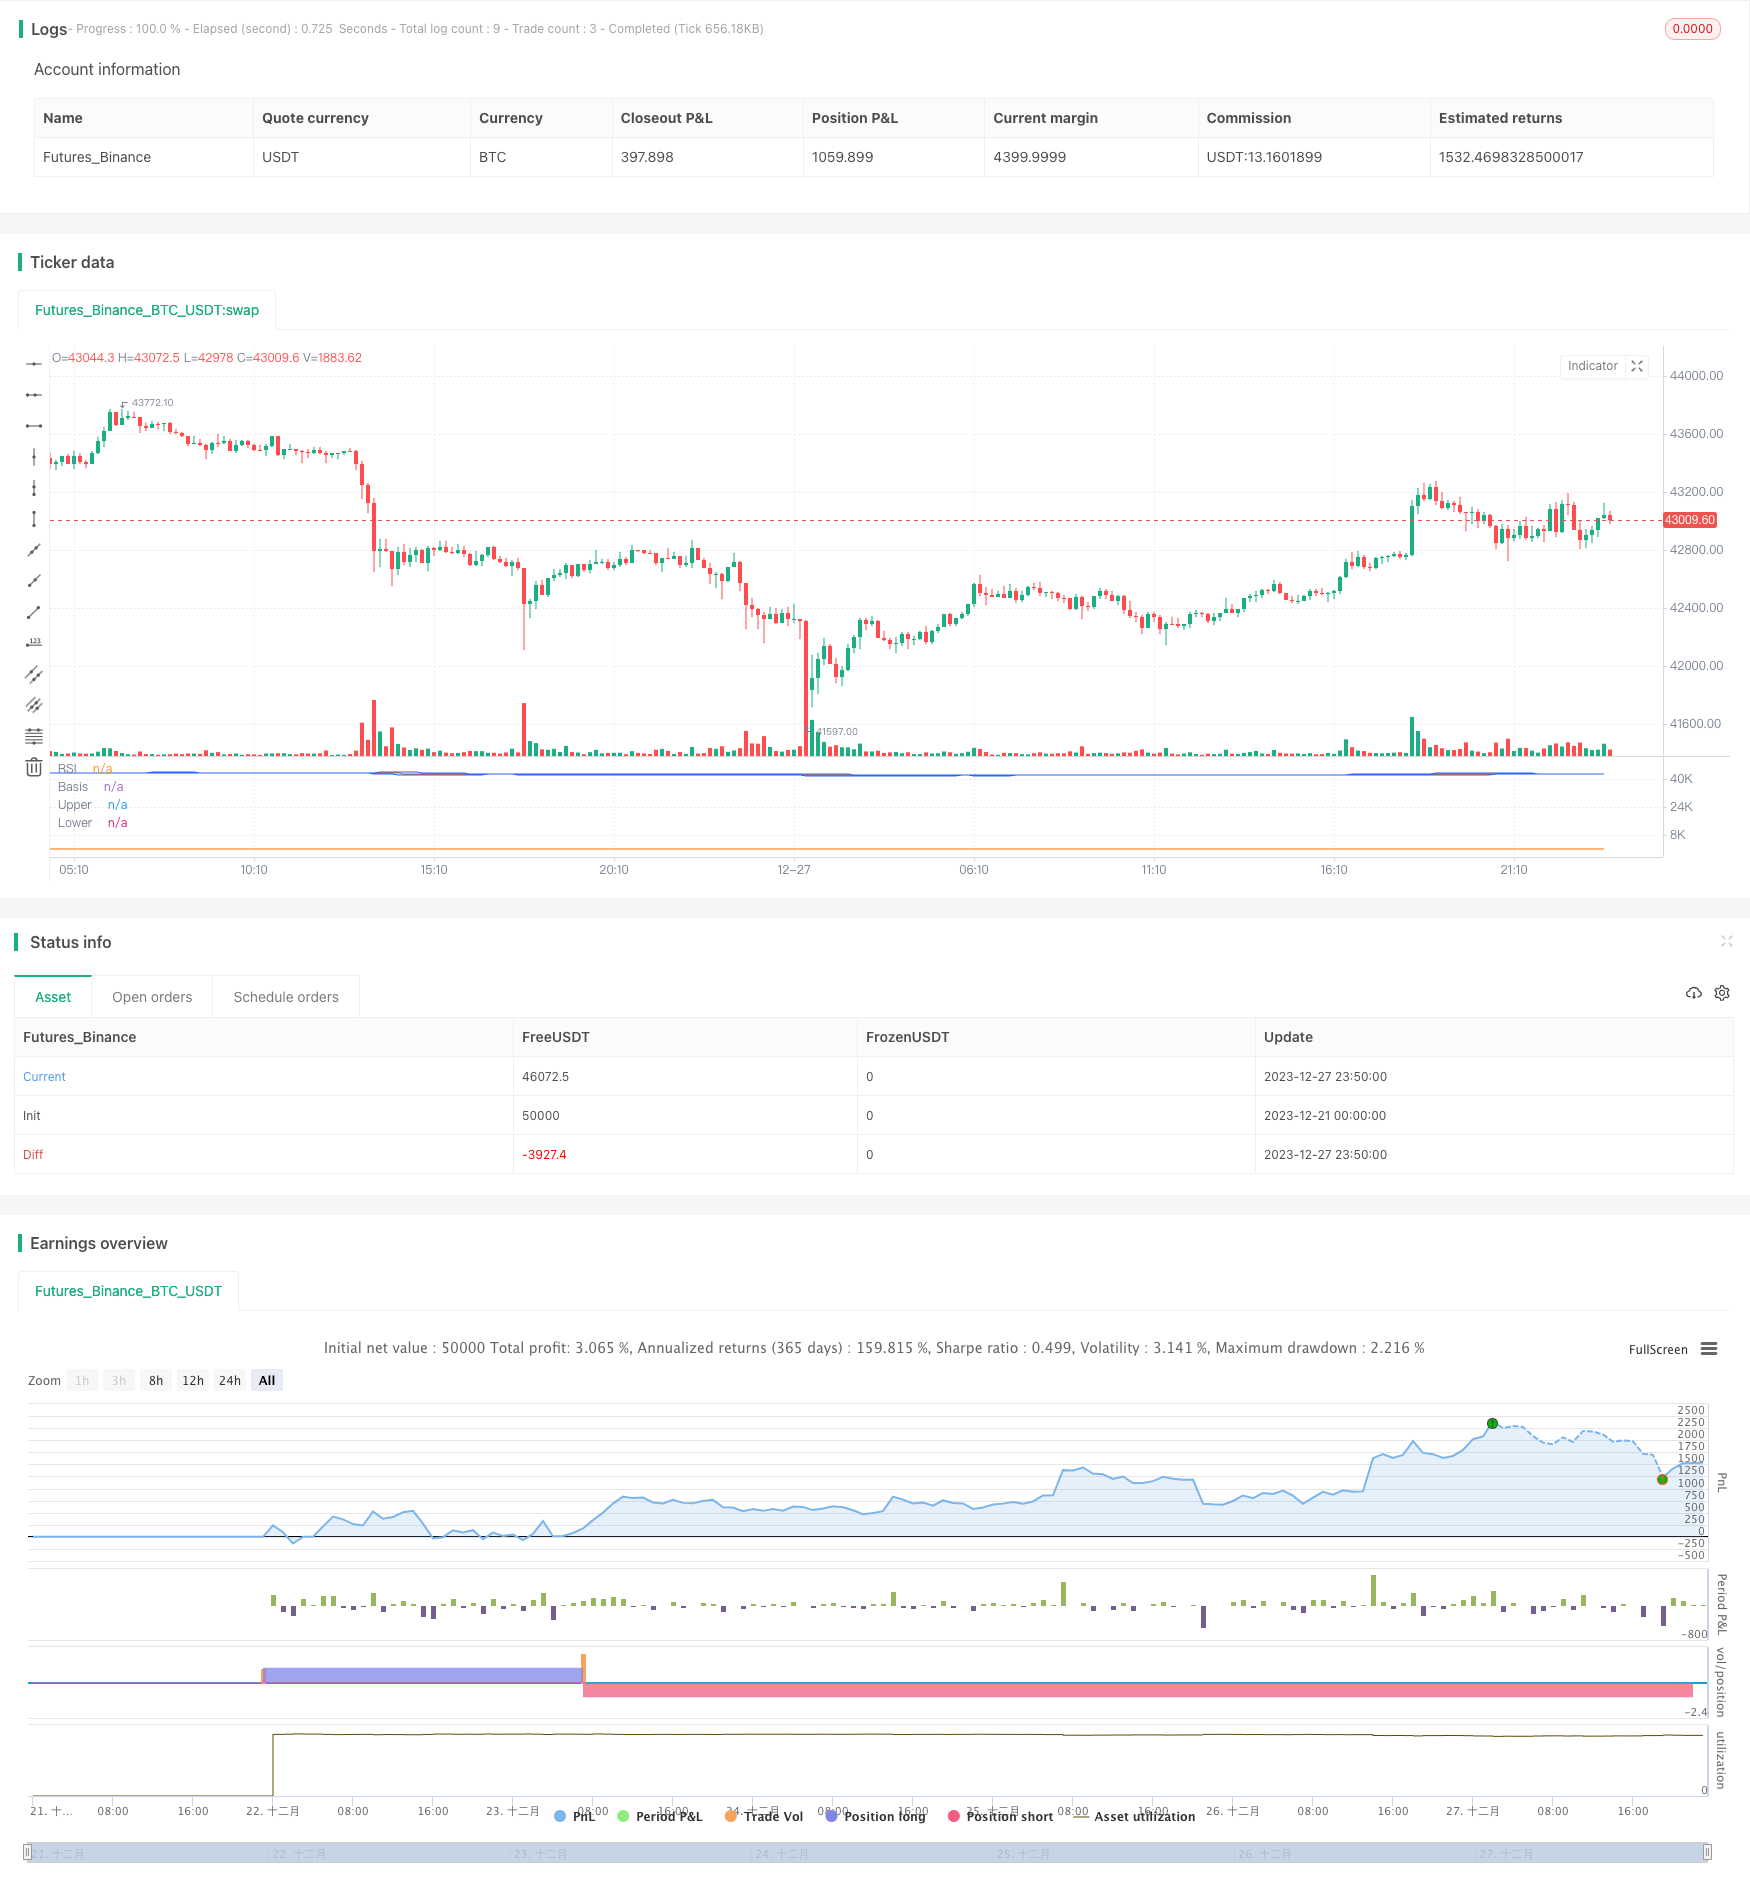
本策略结合使用了博林带和相对强弱指数(RSI)的技术指标,在RSI指标发生金叉或死叉时,判断价格是否触及或突破博林带上轨或下轨,以发出买入和卖出信号。
策略原理
计算20周期的SMA作为基线,上轨为基线+2倍标准差,下轨为基线-2倍标准差,构建博林带。
计算14周期RSI值,RSI高于70为超买区,低30以下为超卖区。
当RSI指标下穿30时,如价格低于下轨,产生买入信号;当RSI指标上穿70时,如价格高于上轨,产生卖出信号。
优势分析
博林带利用标准差范围来判断价格波动和未来走势,有较强的趋势判断能力。
RSI指标判断超买超卖情况,结合博林带轨道判断,可以有效发现反转机会。
RSI指标容易形成突破信号,与博林带结合,信号更加准确可靠。
风险分析
博林带并不是百分之百准确,价格有可能会突破上下轨继续运行。
RSI指标也可能形成假突破信号,与博林带判断结果不一致。
适当调整参数非常重要,参数设置不当可能导致交易信号过于频繁或稀少。
优化方向
可以测试不同周期的参数,寻找最佳参数组合。
可以结合其他指标,如KD,MACD等,提高信号的可靠性。
可以基于回测结果,优化止损止盈策略,控制风险。
总结
本策略集成博林带的趋势分析和RSI指标的超买超卖判断,形成交易信号。总的来说,策略思路清晰,易于实施,具有一定的实战价值。但也存在一定的风险,需要注意参数调整和指标整合,不断优化,使之适应不同市场环境。
策略源码
/*backtest
start: 2023-12-21 00:00:00
end: 2023-12-28 00:00:00
period: 10m
basePeriod: 1m
exchanges: [{"eid":"Futures_Binance","currency":"BTC_USDT"}]
*/

//@version=5
strategy("Bollinger Bands and RSI Strategy", overlay=false)

// Define the parameters
length = input.int(20, "Length", minval=1)
src = input(close, "Source")
mult = input.float(2.0, "StdDev", minval=0.001, maxval=50)
rsiLength = input.int(14, "RSI Length", minval=1)
rsiOverbought = input.int(70, "RSI Overbought Level", minval=1, maxval=100)
rsiOversold = input.int(30, "RSI Oversold Level", minval=1, maxval=100)

// Calculate the Bollinger Bands
basis = ta.sma(src, length)
dev = mult * ta.stdev(src, length)
upper = basis + dev
lower = basis - dev

// Plot the Bollinger Bands
plot(basis, "Basis", color=#FF6D00)
p1 = plot(upper, "Upper", color=#2962FF)
p2 = plot(lower, "Lower", color=#2962FF)
fill(p1, p2, color=color.rgb(33, 150, 243, 90), title="Background")

// Calculate the RSI
rsi = ta.rsi(src, rsiLength)

// Plot the RSI
plot(rsi, "RSI", color=#FF6D00)

// Define the entry and exit conditions
longCondition = ta.crossover(rsi, rsiOversold) and src < lower // Use ta.crossover here
if (longCondition)
    strategy.entry("Long", strategy.long)

shortCondition = ta.crossunder(rsi, rsiOverbought) and src > upper // Use ta.crossunder here
if (shortCondition)
    strategy.entry("Short", strategy.short)

// Plot the buy and sell signals
plotshape(longCondition, title="Buy", location=location.belowbar, color=color.green, style=shape.triangleup, size=size.small)
plotshape(shortCondition, title="Sell", location=location.abovebar, color=color.red, style=shape.triangledown, size=size.small)