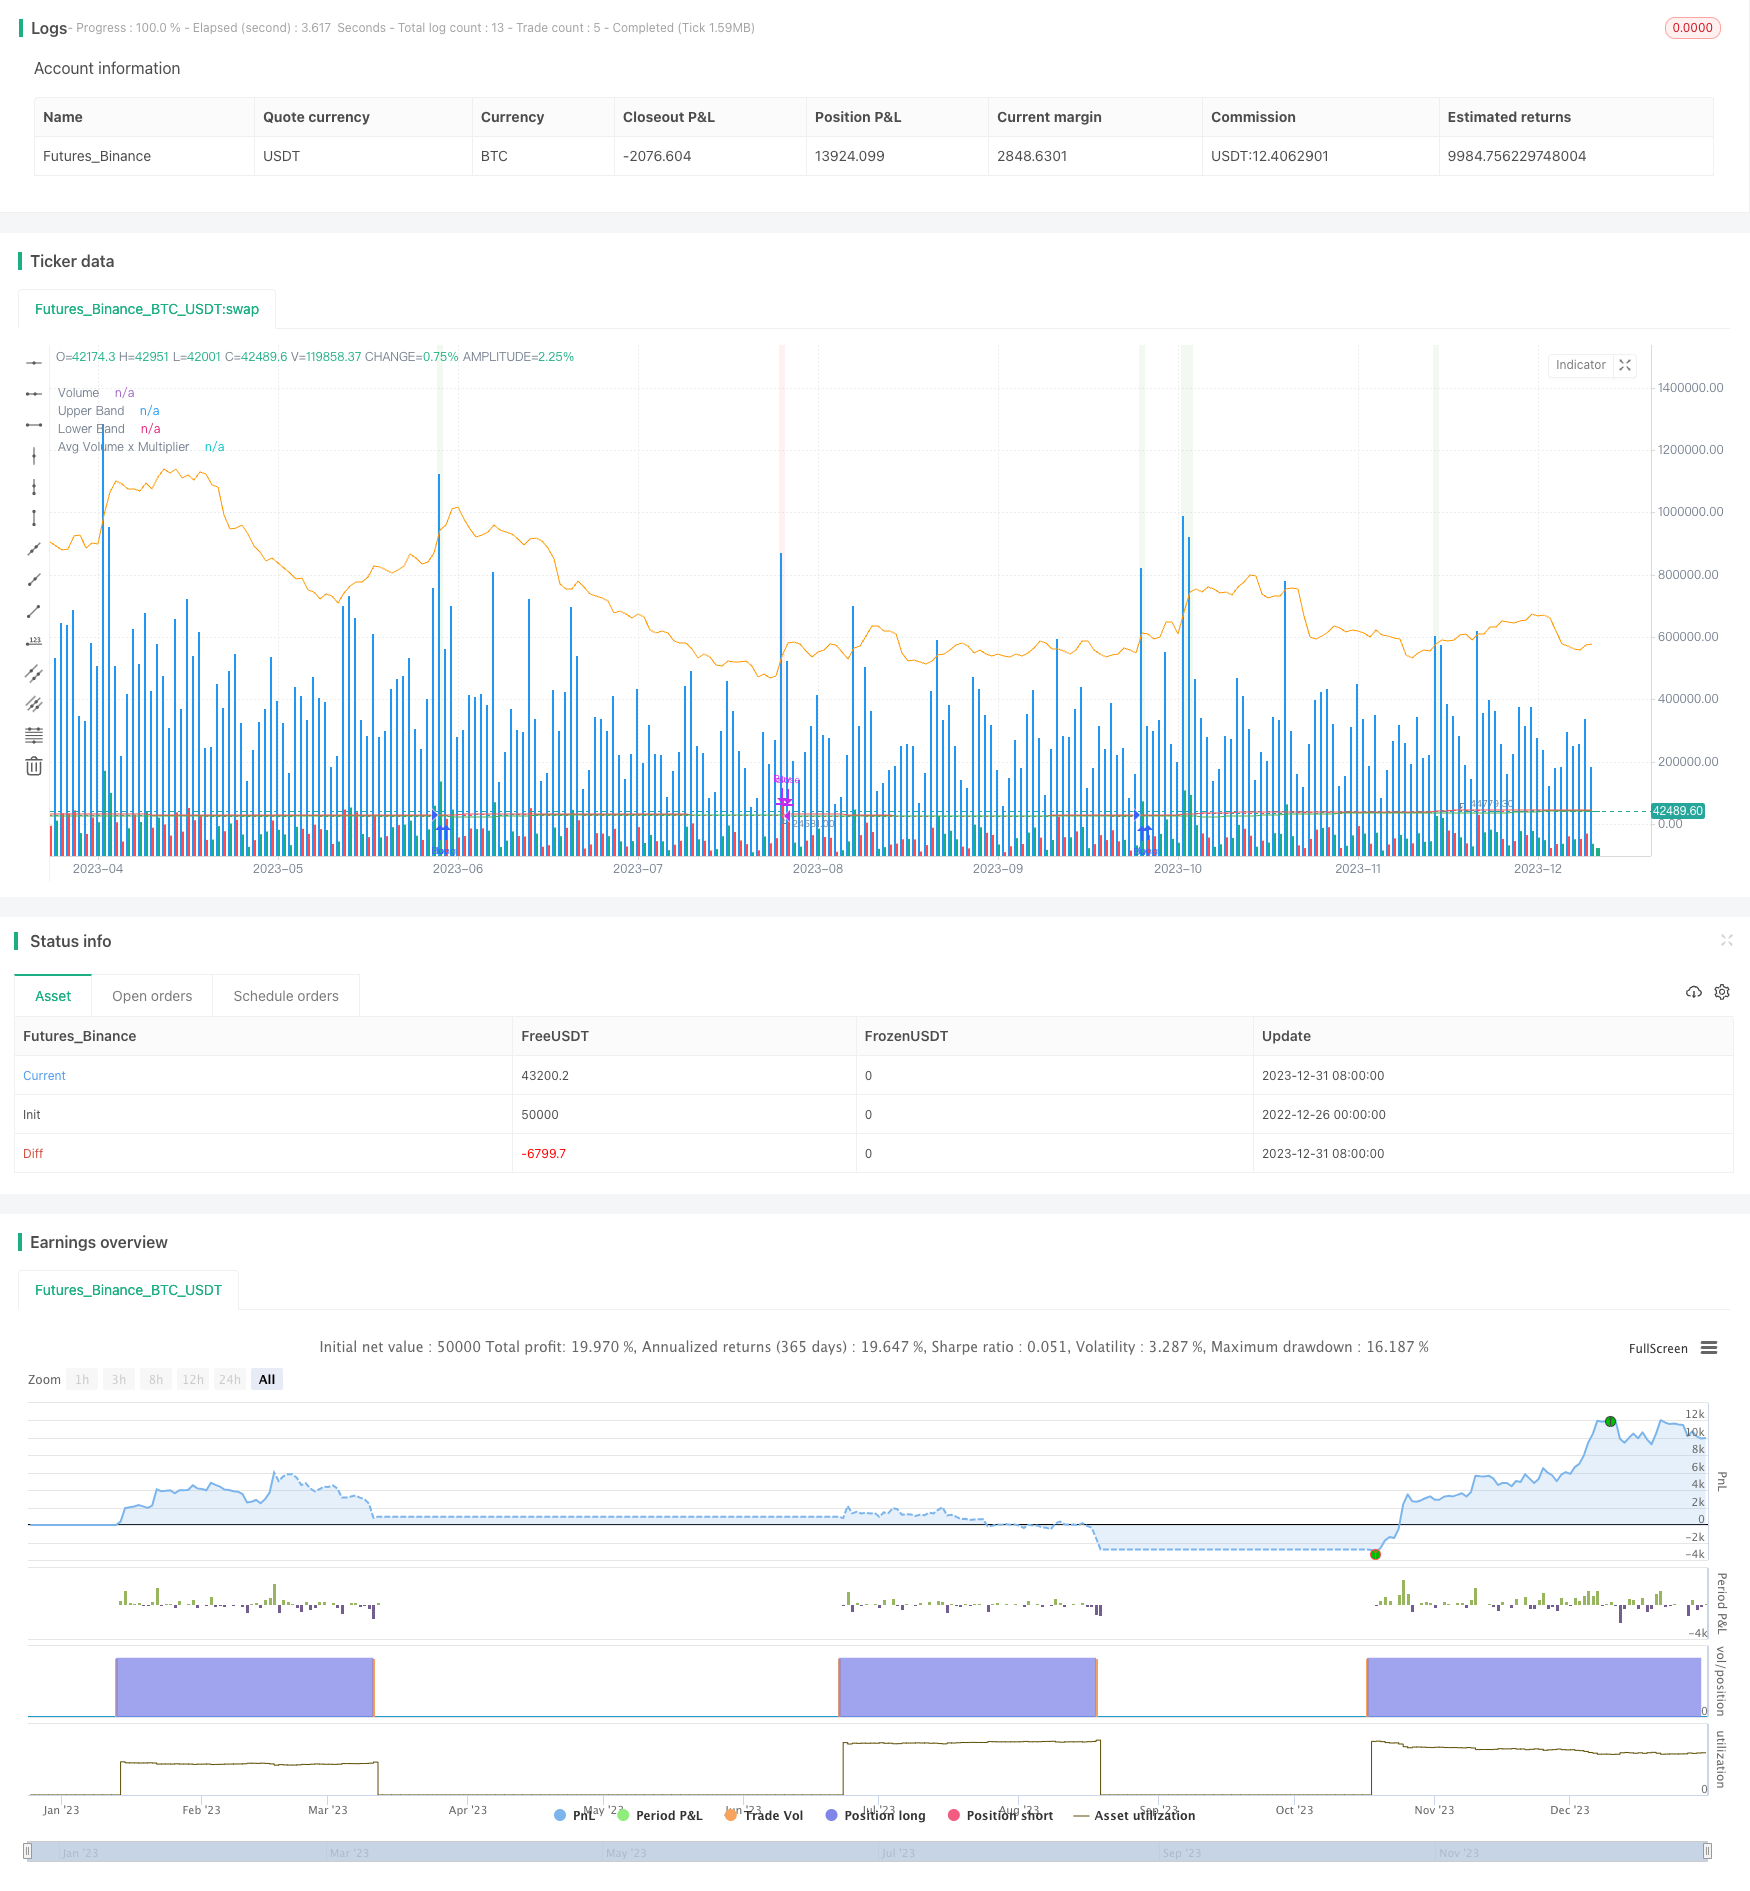
Overview
This strategy is called “Bollinger Bands Volume Confirmation Strategy”. Its core idea is to combine the Bollinger Bands indicator and volume indicator to achieve double confirmation of price movement and trading volume, thereby generating more reliable buy and sell signals.
Strategy Principle
The strategy mainly includes two parts:
Bollinger Bands part. This part calculates the simple moving average of closing prices over a certain period (such as 20 days) and calculates the standard deviation of these closing prices relative to their moving average. Then, according to the value of the standard deviation, two bands are calculated at a standard deviation range above and below the moving average, which is called Bollinger Bands. The band area of Bollinger Bands can clearly show whether the current price is in an “abnormal state”.
Volume part. This part calculates the moving average value of trading volume over the same period (such as 20 days), and then uses a multiplier (such as 2.0) to set a trading volume threshold. Only when the trading volume exceeds this threshold is it regarded as a valid “large” trading volume.
When the price breaks through the upper track of Bollinger Bands and the trading volume exceeds the trading volume threshold, a buy signal is generated; when the price breaks through the lower track of Bollinger Bands, and the trading volume exceeds the trading volume threshold, a sell signal is generated.
By the double confirmation of price and trading volume, some false signals can be filtered out, making the trading strategy more reliable.
Strategy Advantages
Double confirmation mechanism to avoid false breakouts and filter noise. Combining price and volume indicators, signals are generated only when both confirm at the same time, which can effectively avoid some erroneous signals caused by empty price breakouts.
Adjustable parameters. Users can set the period parameters of Bollinger Bands and the multiplier parameters of the trading volume threshold independently to adapt to different market environments.
Intuitive illustration. The upper and lower Bollinger Bands, trading volume, and trading volume threshold indicators enable more intuitive and clear strategy signals.
Risks and Optimization
Bollinger Bands itself cannot perfectly identify trend reversal points. Bollinger Bands can only clearly show the “abnormal state” of prices but cannot predict price reversals. Therefore, it still needs to be combined with other indicators for judgment.
Volume signals may lag. When there is a rapid breakout of the upper and lower Bollinger Bands, the reaction of the trading volume may lag, resulting in a lag in signal generation and inability to perfectly capture turning points.
Try to combine other indicators. Indicators such as KDJ, MACD, etc., introduce more variables to establish more complex multivariate trading strategies, thereby improving the practicality of the strategy.
Summary
By using the method of double confirmation and parameter adjustment, this strategy has filtered out too much noise to some extent, making trading decisions more reliable. But the limitations of Bollinger Bands itself still need to be guarded against. In the future, other indicators can be introduced to optimize and establish diversified quantitative strategies.
/*backtest
start: 2022-12-26 00:00:00
end: 2024-01-01 00:00:00
period: 1d
basePeriod: 1h
exchanges: [{"eid":"Futures_Binance","currency":"BTC_USDT"}]
*/

//@version=5
strategy("Volume + Bollinger Bands Strategy", overlay = true, shorttitle="Vol BB Strategy")

// Bollinger Bands Parameters
length = input(20, title="BB Length")
src = close
mult = input(2.0, title="Multiplier")
basis = ta.sma(src, length)
upper = basis + mult * ta.stdev(src, length)
lower = basis - mult * ta.stdev(src, length)

// Volume Parameters
volMultiplier = input(2.0, title="Volume Multiplier")
avgVolume = ta.sma(volume, length)

// Strategy Logic
buyCondition = close > upper and volume > volMultiplier * avgVolume
sellCondition = close < lower and volume > volMultiplier * avgVolume

// Plotting
plot(upper, color=color.red, title="Upper Band")
plot(lower, color=color.green, title="Lower Band")
plot(volume, color=color.blue, style=plot.style_columns, title="Volume", transp=85)
plot(avgVolume * volMultiplier, color=color.orange, title="Avg Volume x Multiplier")

// Strategy Execution
strategy.entry("Buy", strategy.long, when=buyCondition)
strategy.close("Buy", when=sellCondition)

bgcolor(buyCondition ? color.new(color.green, 90) : sellCondition ? color.new(color.red, 90) : na)