Quantitative Trading Strategy Based on RSI Indicator and Engulfing Pattern
Author: ChaoZhang, Date: 2024-01-03 11:24:08Tags:

Overview
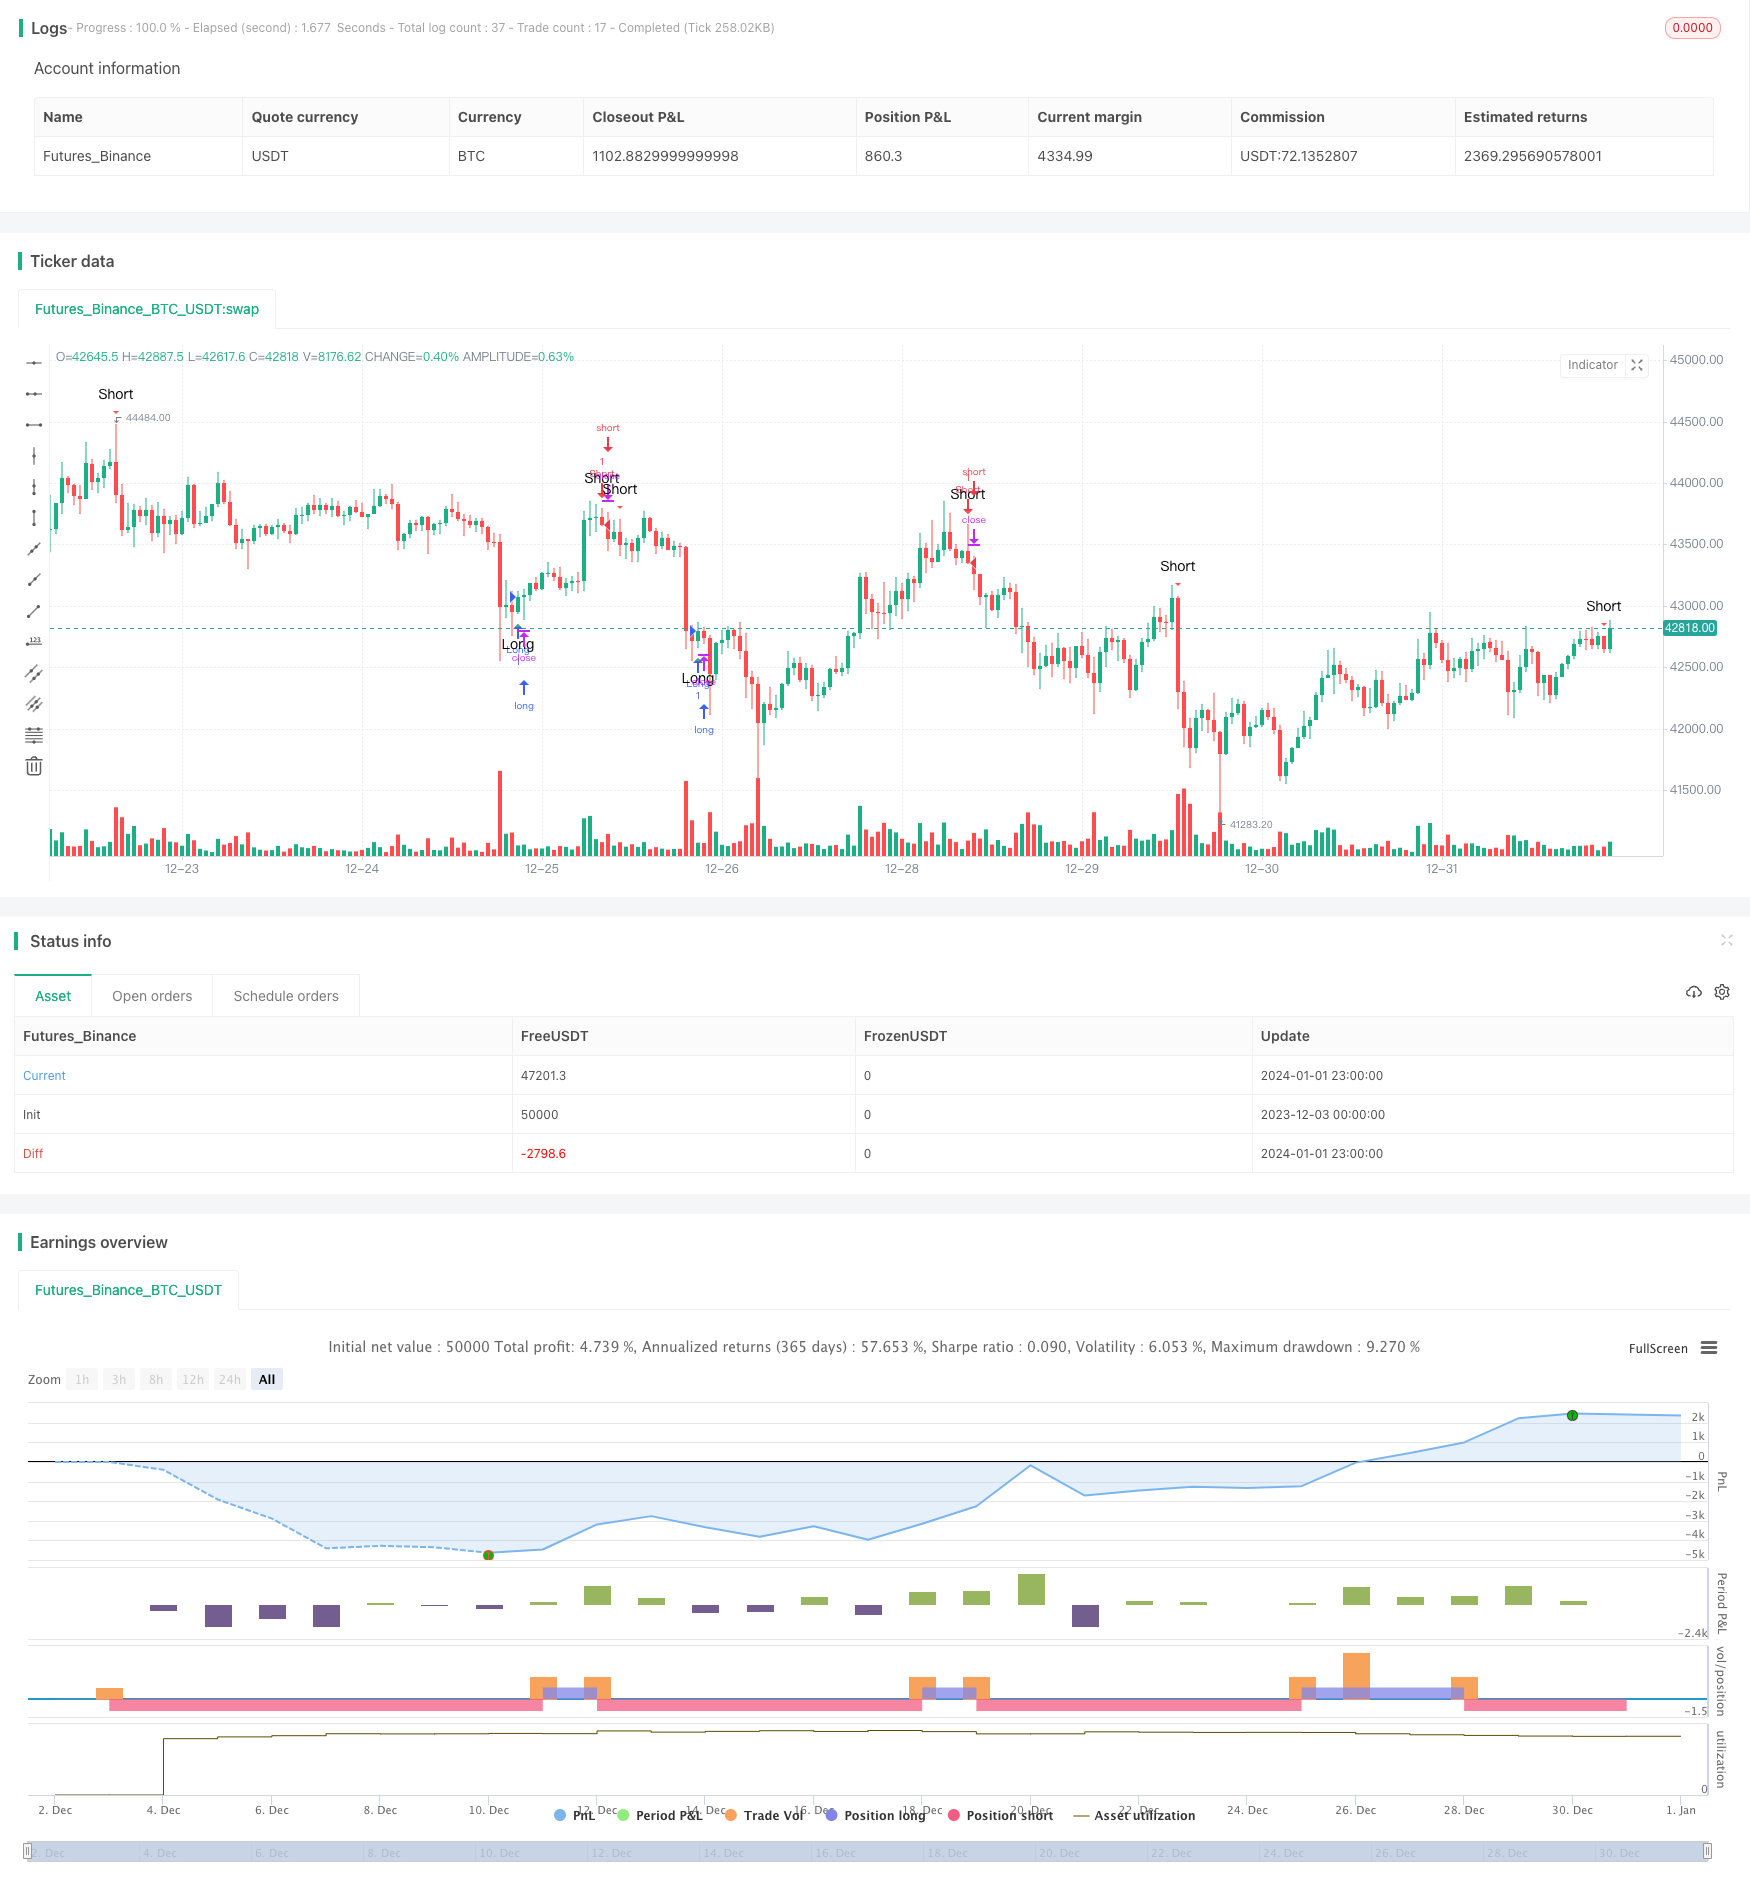
The name of this strategy is “RSI and Engulfing Pattern Quantitative Trading Strategy”. The main idea of this strategy is to identify market trends by using both RSI indicator and engulfing patterns to generate buy and sell signals.
When RSI indicator shows extremities and engulfing patterns appear, we believe it is an opportunity to establish positions. RSI indicator can effectively identify overbought and oversold situations, while engulfing patterns can further verify the reliability of trends.
Strategy Logic
Firstly, we set the parameters for RSI indicator, including the period length of RSI (usually 9 or 14), overbought level (usually 70) and oversold level (usually 30).
Then, we identify engulfing patterns to determine whether a large bullish or bearish candle has engulfed the previous candle. This indicates that the current trend is undergoing a reversal.
After that, if RSI shows overbought or oversold extremities and an bullish engulfing or bearish engulfing appears, buy or sell signals are triggered. Finally, RSI golden cross and death cross are used to determine take profit and stop loss.
Advantages of the Strategy
This strategy combines the trend indicator RSI and the pattern indicator engulfing patterns to comprehensively judge market trends, which has stronger confirmation effectiveness compared to single indicator strategies, and can filter out noisy trading signals effectively.
RSI indicator judges overbought and oversold states very accurately and clearly, while the price-volume characteristics implied in engulfing patterns can further verify the reliability of trend reversals.
This strategy can timely capture reversal opportunities arising from overbought and oversold extremes, while avoiding unnecessary trading losses during consolidations.
Risks of the Strategy
The biggest risk of this strategy is that the probability of RSI indicator and engulfing patterns showing wrong signals is not low. RSI indicator is prone to distortions and divergences. And the identification of engulfing patterns can be manipulated by adjusting parameters like candlestick chart window size.
In addition, the possibility of oscillation and consolidation cannot be completely ruled out when reversal signals appear. The market may have pullbacks or even reversals in the short term after positions are established. These can all lead to stop loss and losses.
In order to reduce risks, we need to optimize the parameter settings of RSI indicator to find the best parameter combination. In addition, selecting trading instruments with strong representation and liquidity is also very important. After establishing positions, we need to properly control position sizing and set timely stop loss.
Directions for Strategy Optimization
This strategy can be further optimized in the following aspects:
-
Incorporate more indicators such as KDJ and MACD to form a multi-indicator verification system to improve signal accuracy.
-
Consider factors like liquidity, volatility and transaction cost of trading instruments, and select the optimal ones to reduce trading cost and slippage risks.
-
Use machine learning methods to train and optimize parameters. For example, use deep learning to identify RSI divergences.
-
Add stop loss strategies, and protect profits through moving stop loss, MA stop loss etc.
Conclusion
This strategy utilizes the strengths of RSI indicator and engulfing patterns, and designs a quantitative trading system that takes into account both trend judgment and feature verification. It can effectively capture reversal opportunities while having high reliability. Through continuous optimization, this strategy can become a stable and reliable quantitative strategy.
/*backtest
start: 2023-12-03 00:00:00
end: 2024-01-02 00:00:00
period: 1h
basePeriod: 15m
exchanges: [{"eid":"Futures_Binance","currency":"BTC_USDT"}]
*/

//@version=4
strategy(title="Lesson 6", shorttitle="RSI Swing Signals", overlay=true)

// Get user input
rsiSource = input(title="RSI Source", type=input.source, defval=close)
rsiLength = input(title="RSI Length", type=input.integer, defval=9)
rsiOverbought = input(title="RSI Overbought Level", type=input.integer, defval=60)
rsiOversold = input(title="RSI Oversold Level", type=input.integer, defval=25)

// Get RSI value
rsiValue = rsi(rsiSource, rsiLength)
rsiOB = rsiValue >= rsiOverbought
rsiOS = rsiValue <= rsiOversold

// Identify engulfing candles
bullishEC = close > open[1] and close[1] < open[1]
bearishEC = close < open[1] and close[1] > open[1]

// Define entry and exit conditions
longCondition = (rsiOS or rsiOS[1]) and bullishEC
shortCondition = (rsiOB or rsiOB[1]) and bearishEC

// Plot signals to chart
plotshape(longCondition, title="Long", location=location.belowbar, color=color.green, transp=0, style=shape.triangleup, text="Long")
plotshape(shortCondition, title="Short", location=location.abovebar, color=color.red, transp=0, style=shape.triangledown, text="Short")

// Strategy entry and exit
strategy.entry("Long", strategy.long, when=longCondition)
strategy.entry("Short", strategy.short, when=shortCondition)

// Define exit conditions
longExitCondition = crossover(rsiValue, 60) // You can customize this exit condition
shortExitCondition = crossunder(rsiValue, 40) // You can customize this exit condition

// Strategy exit
strategy.exit("ExitLong", from_entry="Long", when=longExitCondition)
strategy.exit("ExitShort", from_entry="Short", when=shortExitCondition)

// Send out an alert if this candle meets our conditions
alertcondition(longCondition or shortCondition, title="RSI Trade Alert!", message="RSI Swing Signal for XXX")
- Long and Short Opening Strategy Based on Multi Timeframe Moving Average and MACD
- Momentum Indicator RSI Reversal Trading Strategy
- Double Bollinger Band Breakout Strategy
- Automatic Tracking Trend Strategy Based on T3 and ATR
- ATR Channel Breakout Trend-following Strategy
- MACD 200 Day Moving Average Crossover Trading Strategy
- Golden Cross Uptrend Tracking Strategy
- Dual EMA Crossover Oscillation Tracking Strategy
- Stiffness Breakthrough Strategy
- Sideways Breakthrough Oscillation Strategy
- Bollinger Bands ATR Trailing Stop Strategy
- Daily Breakout Strategy
- Signal-to-Noise Moving Average Trading Strategy Based on Quantitative Trading
- Momentum Crossover Moving Average and MACD Filter Heikin-Ashi Candlestick Strategy
- Strategy of Synthesis between Multiple Relative Strength Indicators
- Random Fisher Transform Temporary Stop Reverse STOCH Indicator Quantitative Strategy
- Adaptive Stop Loss Rail Strategy
- Bollinger Bands Volume Confirmation Quantitative Trading Strategy
- Parameter Optimized Trend Following Quantitative Strategy
- Moving Vegas Channel Crossover Strategy