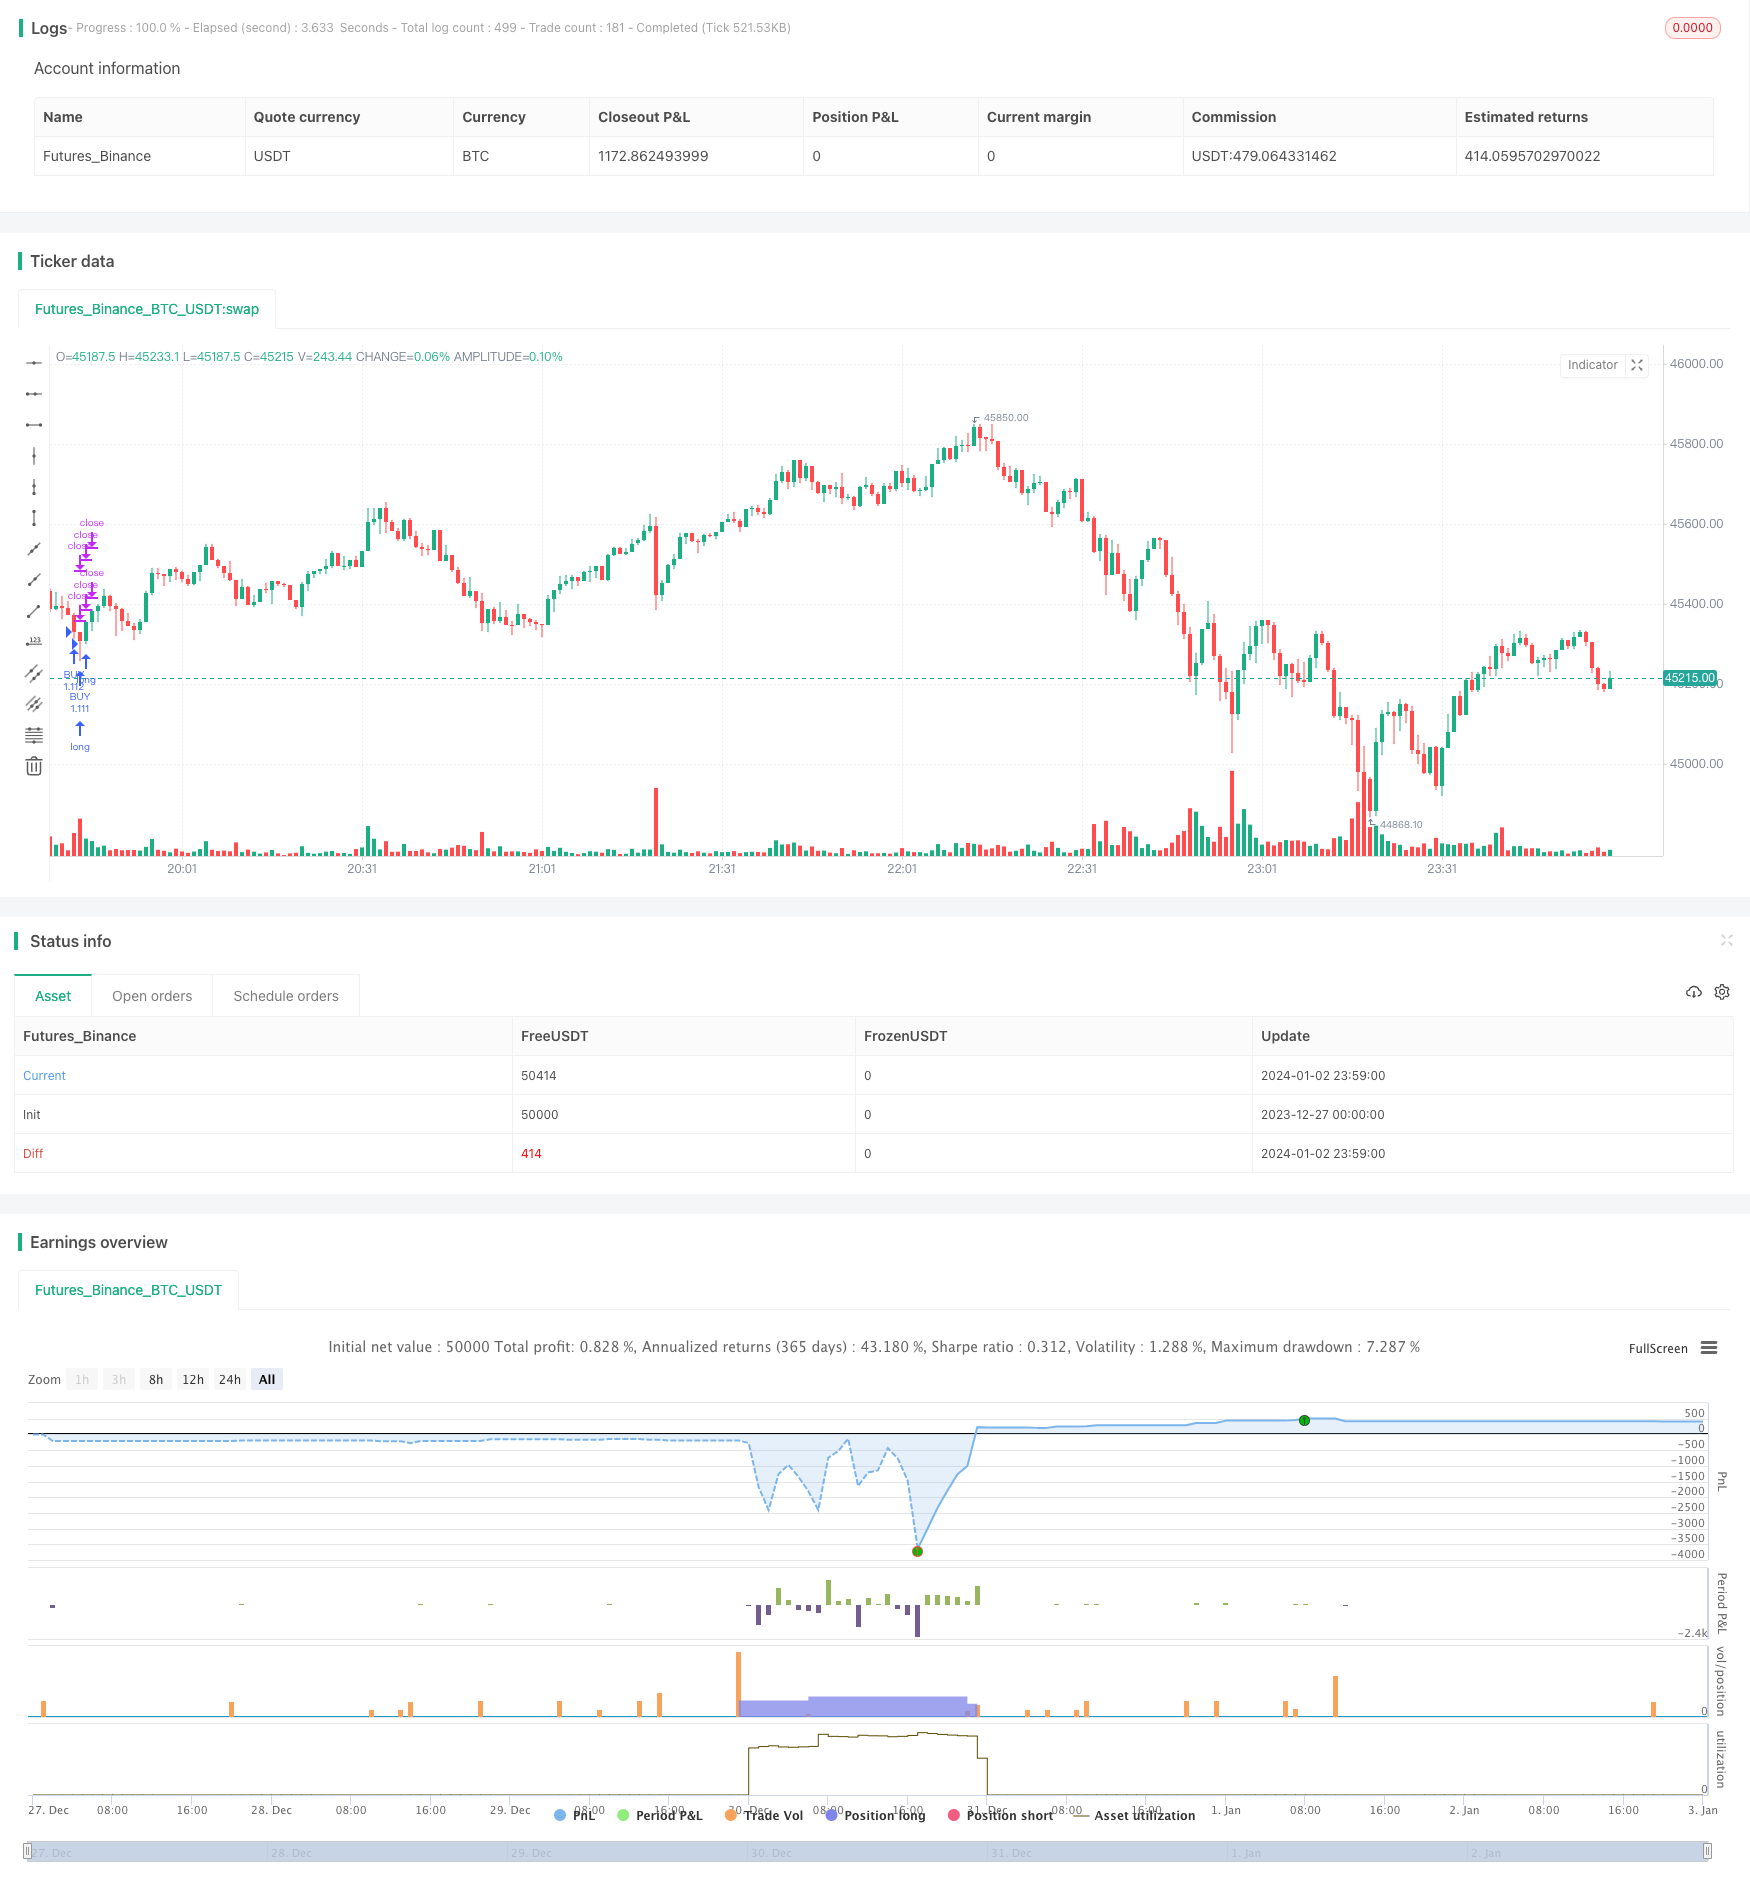
Overview
This strategy identifies buying opportunities by combining trading volume and RSI indicators. It manages positions using staged take profit targets to lock in gains gradually. The strategy works well during range-bound markets and can effectively capture recurring buying signals within small price swings.
Strategy Logic
The strategy utilizes two indicators to identify buy signals - trading volume and RSI. Specifically, it goes long when volume surpasses 2.5 times the 70-day average volume, together with RSI dropping below 30 (oversold levels).
Once a long position is established, the strategy sets 5 take profit targets at 0.4%, 0.6%, 0.8%, 1.0% and 1.2%. It closes out positions gradually based on position ratio (20%, 40%, 60%, 80% and 100%) until fully exiting. A 5% stop loss is also set.
By taking profits in stages, it aims to lock in gains amid minor upside moves, instead of waiting for larger runs which may not materialize. The stop loss controls downside risk on a per trade basis.
Advantage Analysis
The key advantages of this strategy are:
Using dual indicators prevents false breakouts. Elevated volume confirms bottom conviction while oversold RSI signals mean reversion odds.
Taking profits in batches allows maximizing small upside captures within ranges. No need to wait for huge runs to make money.
Excels in range-bound markets, especially those stuck around institutional unfinished areas. Frequent small gains can be captured in the absence of trend.
Wide stop loss allows markets room for whipsaws before getting stopped out. Avoids prematurely exiting short-term retracements.
Risk Analysis
The main risks are:
Dual signal misinterpretation leading to false entries. Can be mitigated via parameter optimization.
Staged profit taking risks missing large trend moves due to small position sizing. Optimizing take profit levels and position ratios helps.
Wide stops lead to potentially large single-trade losses. Position sizing is key to managing risk.
Strong trending markets pose directional bias risks. Pay attention to larger timeframe structure.
High trade frequency increases transaction costs. Using low-commission brokers is preferred.
Optimization Directions
Possible optimization directions include:
Optimizing volume and RSI combinations to reduce false signals. Adding confirmations like MACD and KDJ.
Testing different take profit levels and position ratios for ideal configurations, potentially with dynamic mechanisms.
Introducing position sizing rules to cut max risk per trade via risk management systems.
Incorporating trend metrics to detect reversals for timely stop losses. Avoid overholding in shifting markets.
Leveraging algorithmic backtesting to swiftly iterate parameters for best configurations.
Learning from institutional HFT slippage/cost control models to improve efficiency despite high turnover.
Conclusion
This dual indicator mean reversion strategy identifies bottom signals with volume surges and oversold RSI for buying, taking gradual profits amid ranges via staged exits. It profits frequently without requiring huge runs. Downsides include signal misinterpretation risks and high turnover. Confirmation optimization and risk/cost controls improve robustness. Excellent for short-term gains harvesting in choppy markets.
/*backtest
start: 2023-12-27 00:00:00
end: 2024-01-03 00:00:00
period: 1m
basePeriod: 1m
exchanges: [{"eid":"Futures_Binance","currency":"BTC_USDT"}]
*/

// This source code is subject to the terms of the Mozilla Public License 2.0 at https://mozilla.org/MPL/2.0/
// © wielkieef

//@version=5

strategy(title='BTFD strategy [3min]', overlay=true, pyramiding=5, initial_capital=10000, default_qty_type=strategy.percent_of_equity, default_qty_value=100, calc_on_order_fills=false, slippage=0, commission_type=strategy.commission.percent, commission_value=0.03)


// Volume

vol_sma_length = input.int(70, title='Volume lenght  ', minval=1)
Volume_condt = volume > ta.sma(volume, vol_sma_length) * 2.5


// Rsi

rsi_lenght = input.int(20, title='RSI lenght', minval=0)
rsi_up = ta.rma(math.max(ta.change(close), 0), rsi_lenght)
rsi_down = ta.rma(-math.min(ta.change(close), 0), rsi_lenght)
rsi_value = rsi_down == 0 ? 100 : rsi_up == 0 ? 0 : 100 - 100 / (1 + rsi_up / rsi_down)

rsi_overs = rsi_value <= 30
rsi_overb = rsi_value >= 70


// logic

tp_1 = input.float(0.4,"  TP 1", minval=0.1, step=0.1)
tp_2 = input.float(0.6,"  TP 2", minval=0.2, step=0.1)
tp_3 = input.float(0.8,"  TP 3", minval=0.3, step=0.1)
tp_4 = input.float(1.0,"  TP 4", minval=0.4, step=0.1)
tp_5 = input.float(1.2,"  TP 5", minval=0.5, step=0.1)

q_1 = input.int(title='  % TP 1 Q ', defval=20,  minval=1, step=10)
q_2 = input.int(title='  % TP 2 Q ', defval=40,  minval=1, step=10)
q_3 = input.int(title='  % TP 3 Q ', defval=60,  minval=1, step=10)
q_4 = input.int(title='  % TP 4 Q ', defval=80,  minval=1, step=10)
q_5 = input.int(title='  % TP 5 Q ', defval=100, minval=1, step=10)

sl = input.float(5.0, '% Stop Loss', step=0.1)

long_cond = Volume_condt and rsi_overs

// this code is from author RafaelZioni, modified by wielkieef
per(procent) =>
    strategy.position_size != 0 ? math.round(procent / 100 * strategy.position_avg_price / syminfo.mintick) : float(na)
// --------------------------------------------------------------------------------------------------------------------

if  long_cond
    strategy.entry('BUY', strategy.long)

strategy.exit('TP 1', qty_percent=q_1, profit=per(tp_1), loss=per(sl) )
strategy.exit('TP 2', qty_percent=q_2, profit=per(tp_2), loss=per(sl) )
strategy.exit('TP 3', qty_percent=q_3, profit=per(tp_3), loss=per(sl) )
strategy.exit('TP 4', qty_percent=q_4, profit=per(tp_4), loss=per(sl) )
strategy.exit('TP 5', qty_percent=q_5, profit=per(tp_5), loss=per(sl) )


// by wielkieef