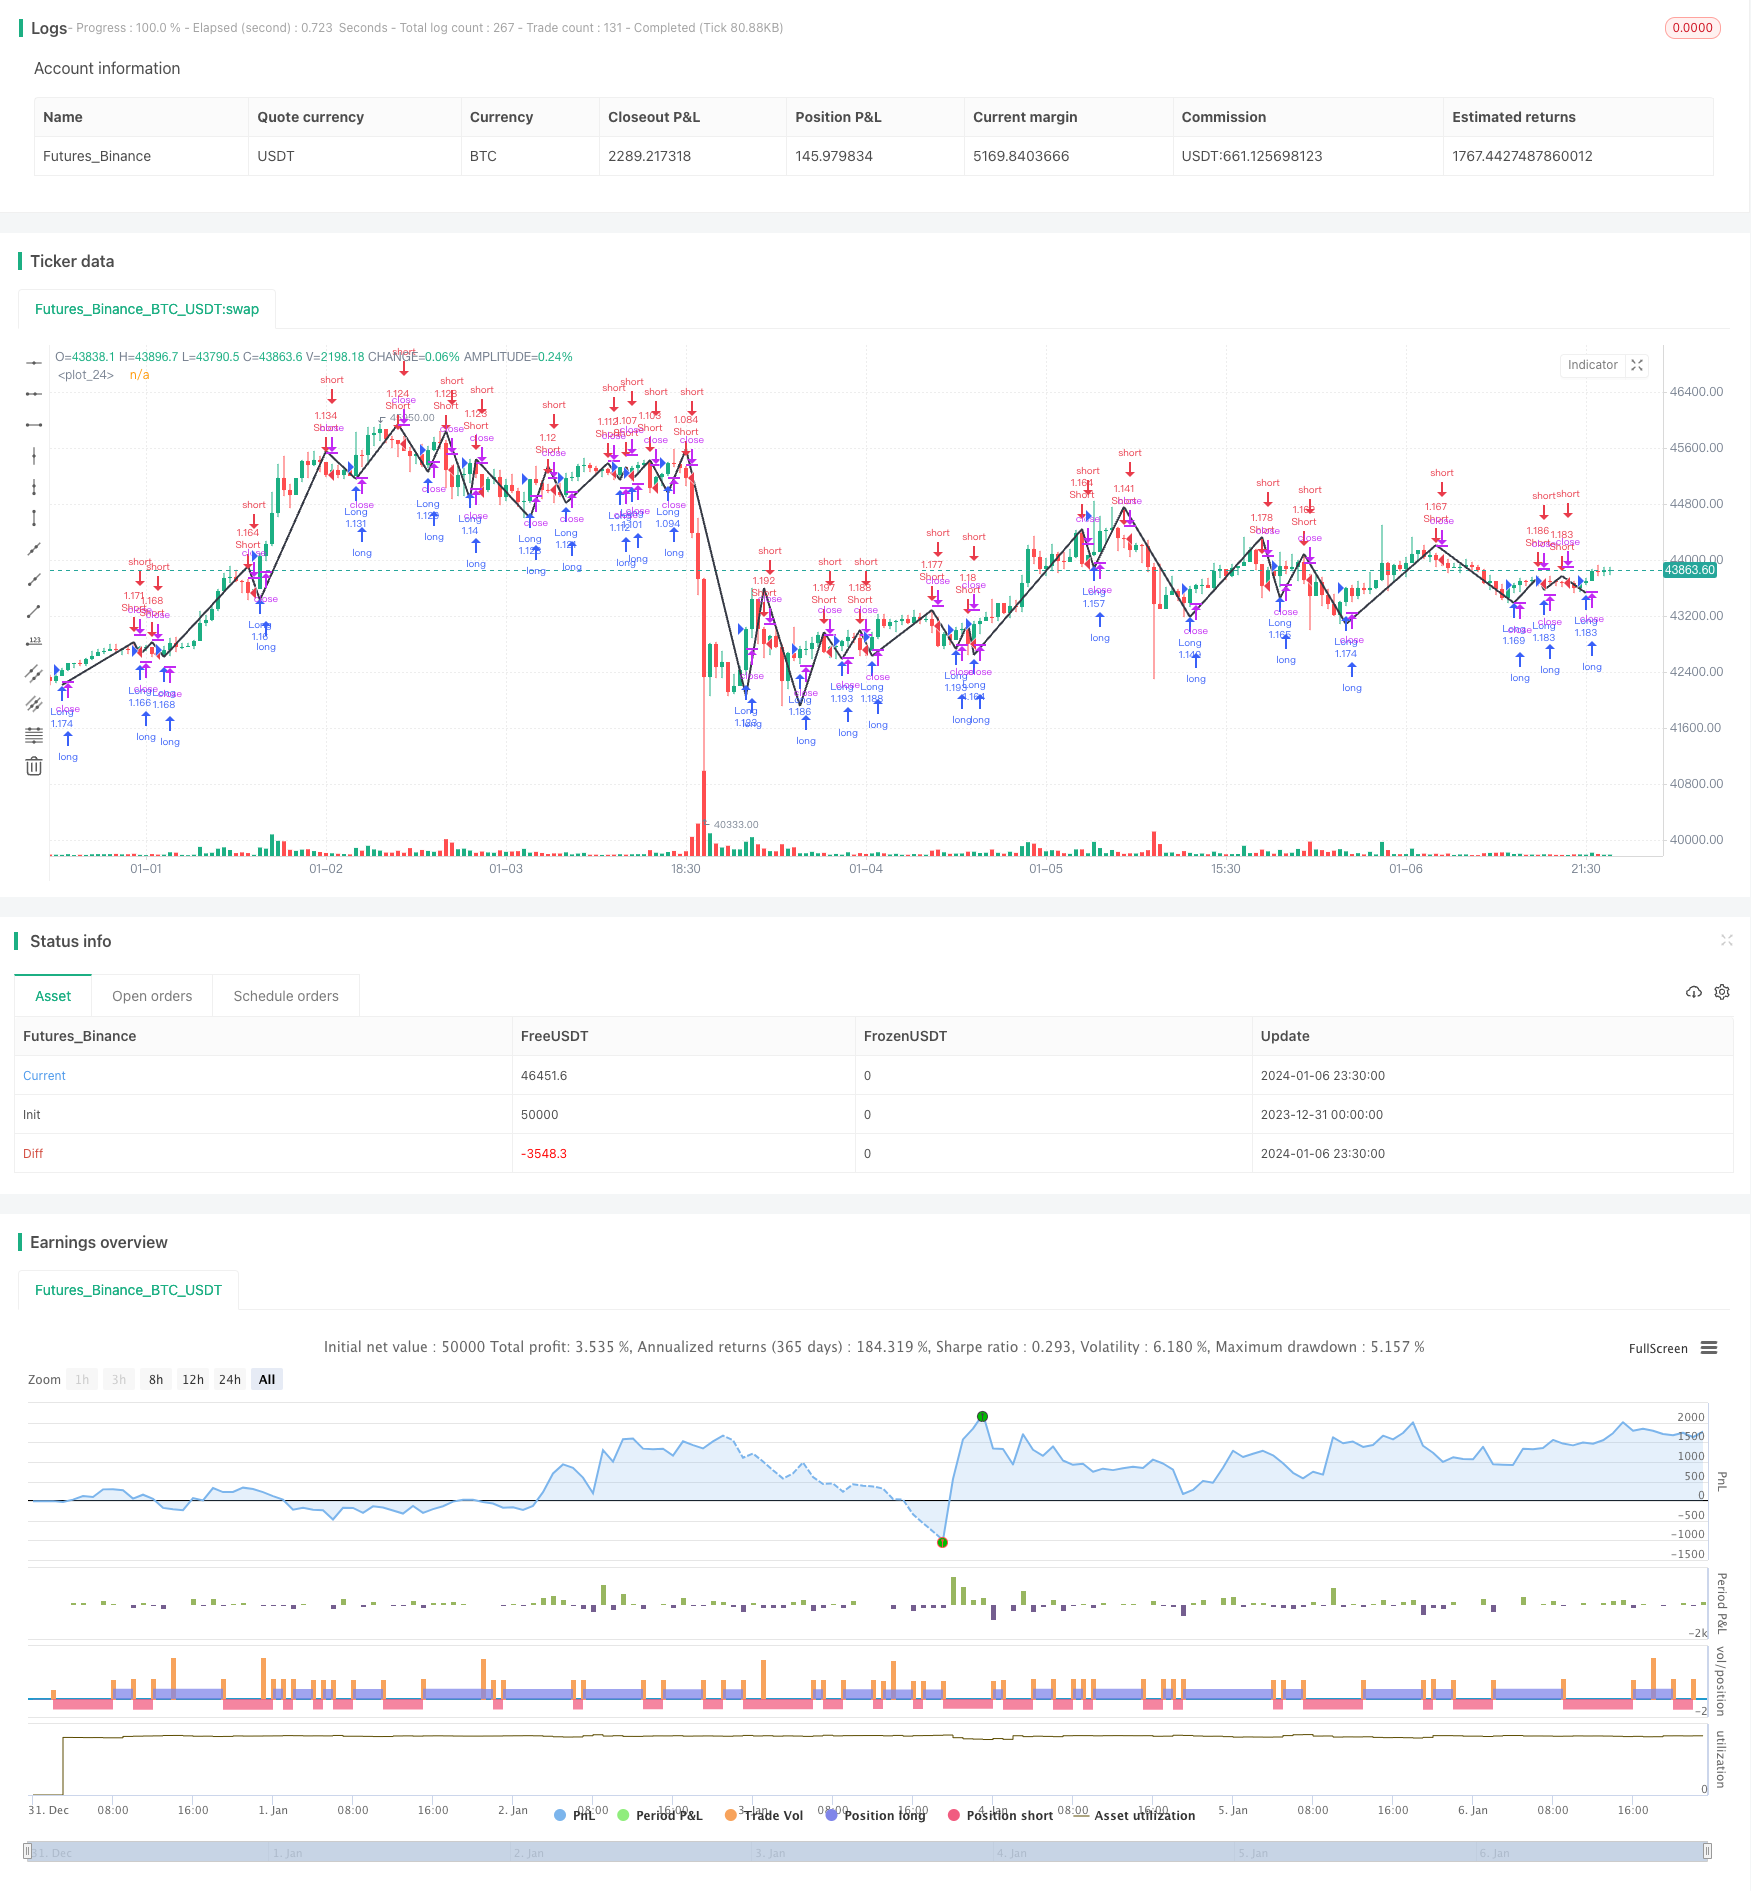
Overview
This article introduces a trading strategy called “ZigZag Trend Following Strategy”. This strategy identifies price trends using the ZigZag indicator and opens positions when trends reverse to follow the trend. In the Strategy Pine script, the ZigZag indicator is used to confirm new highs and lows of prices. When prices break through the ZigZag indicator line, it serves as trading signals. The buy signal is when the closing price is above the ZigZag indicator line to go long; The sell signal is when the closing price is below the ZigZag indicator line to go short. This can effectively track medium-to-long term price trends.
Strategy Principle
The core of this strategy is to use the ZigZag indicator to locate extreme points of prices and display price trends. The ZigZag indicator consists of the Exponential Moving Average (EMA) of high and low prices. Specifically, it consists of the following steps:
Calculate the exponential moving average EMA of close prices, including three moving average lines: fast line, middle line, and slow line.
Judge whether prices are in an uptrend. That is, whether the current middle line is higher than the middle line of the previous K-line.
If it is currently in an upward trend, find the lowest price counted from the start of the previous wave of low points within the detected cycle as the value of ZigZag.
If it is currently in a downward trend, find the highest price counted from the start of the previous wave of high points within the detected cycle as the value of ZigZag.
Thus, the ZigZag indicator reflecting the extreme points of price fluctuations is formed.
On this basis, we use the ZigZag line as a reference to judge the price trend. That is, when the price rises and breaks through the ZigZag indicator line, we go long; when the price falls and breaks through the ZigZag indicator line, we go short.
Advantage Analysis
The advantages of using the ZigZag indicator to determine price trends and track price extremes as positions establishment are:
Can effectively filter market noise and capture major trends.
Trading signals established on the breakouts of new highs and lows can profit efficiently.
ZigZag lines are relatively smooth, which can reduce false signals.
Easy to optimize strategies by adjusting ZigZag parameters.
Risk Analysis
The main risks of this strategy are:
Long-term running may be trapped due to violent fluctuations in the market. Timely stop loss is required at this time.
ZigZag indicators are sensitive to parameters. Improper settings may miss trading opportunities or generate false signals. Parameters need to be tested and optimized appropriately.
Trend tracking strategies rely more on trending markets. If there is sideways range-bound, the effectiveness of this strategy is poor.
In response to the above risks, we can set stop loss mechanisms to control single loss; at the same time, adjust the position size instead of seeking full position; finally, match different types of strategy portfolio.
Optimization Direction
We can further optimize this strategy in the following aspects:
Add a stop loss mechanism. For example, set up moving stop loss or stop loss for price retracement amplitude.
Combine with other indicators for position filter. For example, enhance momentum indicators to ensure sufficient momentum; or trading volume indicators to ensure high trading volumes.
Adopt different parameter configurations according to different market environments (such as bull and bear markets).
Test different EMA line parameters to find the best parameter combination.
Conclusion
This strategy uses the ZigZag indicator to determine price trends and establishes tracking positions near extreme points. Its advantage is to follow the trend efficiently for profit. It also has the risk of being trapped. We can set stop loss, optimize parameters and trade strategy portfolio to control risks. This strategy is more suitable for medium-to-long term trend trading. If properly controlled and combined, it can obtain stable returns.
/*backtest
start: 2023-12-31 00:00:00
end: 2024-01-07 00:00:00
period: 30m
basePeriod: 15m
exchanges: [{"eid":"Futures_Binance","currency":"BTC_USDT"}]
*/

//@version=3
strategy(title = "Noro's ZigTrend Strategy v1.0", shorttitle = "ZigTrend 1.0", overlay = true, default_qty_type = strategy.percent_of_equity, default_qty_value = 100, pyramiding = 0)

//Settings
needlong = input(true, defval = true, title = "Long")
needshort = input(true, defval = true, title = "Short")
capital = input(100, defval = 100, minval = 1, maxval = 10000, title = "Capital, %")
length = input(4)
ExtremeDetection = input(4)
src = input(close)
fromyear = input(1900, defval = 1900, minval = 1900, maxval = 2100, title = "From Year")
toyear = input(2100, defval = 2100, minval = 1900, maxval = 2100, title = "To Year")
frommonth = input(01, defval = 01, minval = 01, maxval = 12, title = "From Month")
tomonth = input(12, defval = 12, minval = 01, maxval = 12, title = "To Month")
fromday = input(01, defval = 01, minval = 01, maxval = 31, title = "From day")
today = input(31, defval = 31, minval = 01, maxval = 31, title = "To day")

//ZigZag
f_zz(_length, _detection)=>
    _hls = ema(ema(ema(src, _length), round(_length*0.66)), round(_length*0.33))
    _isRising = _hls >= _hls[1]
    _zigzag = _isRising and not _isRising[1] ? lowest(_detection) :  not _isRising and _isRising[1] ? highest(_detection) : na
zigzag = f_zz(length, ExtremeDetection)
plot(zigzag, color=black, linewidth=2)

//Signals
up = close > zigzag
dn = close < zigzag

//Trading
lot = 0.0
lot := strategy.position_size != strategy.position_size[1] ? strategy.equity / close * capital / 100 : lot[1]
if up
    strategy.entry("Long", strategy.long, needlong == false ? 0 : lot)

if dn
    strategy.entry("Short", strategy.short, needshort == false ? 0 : lot)