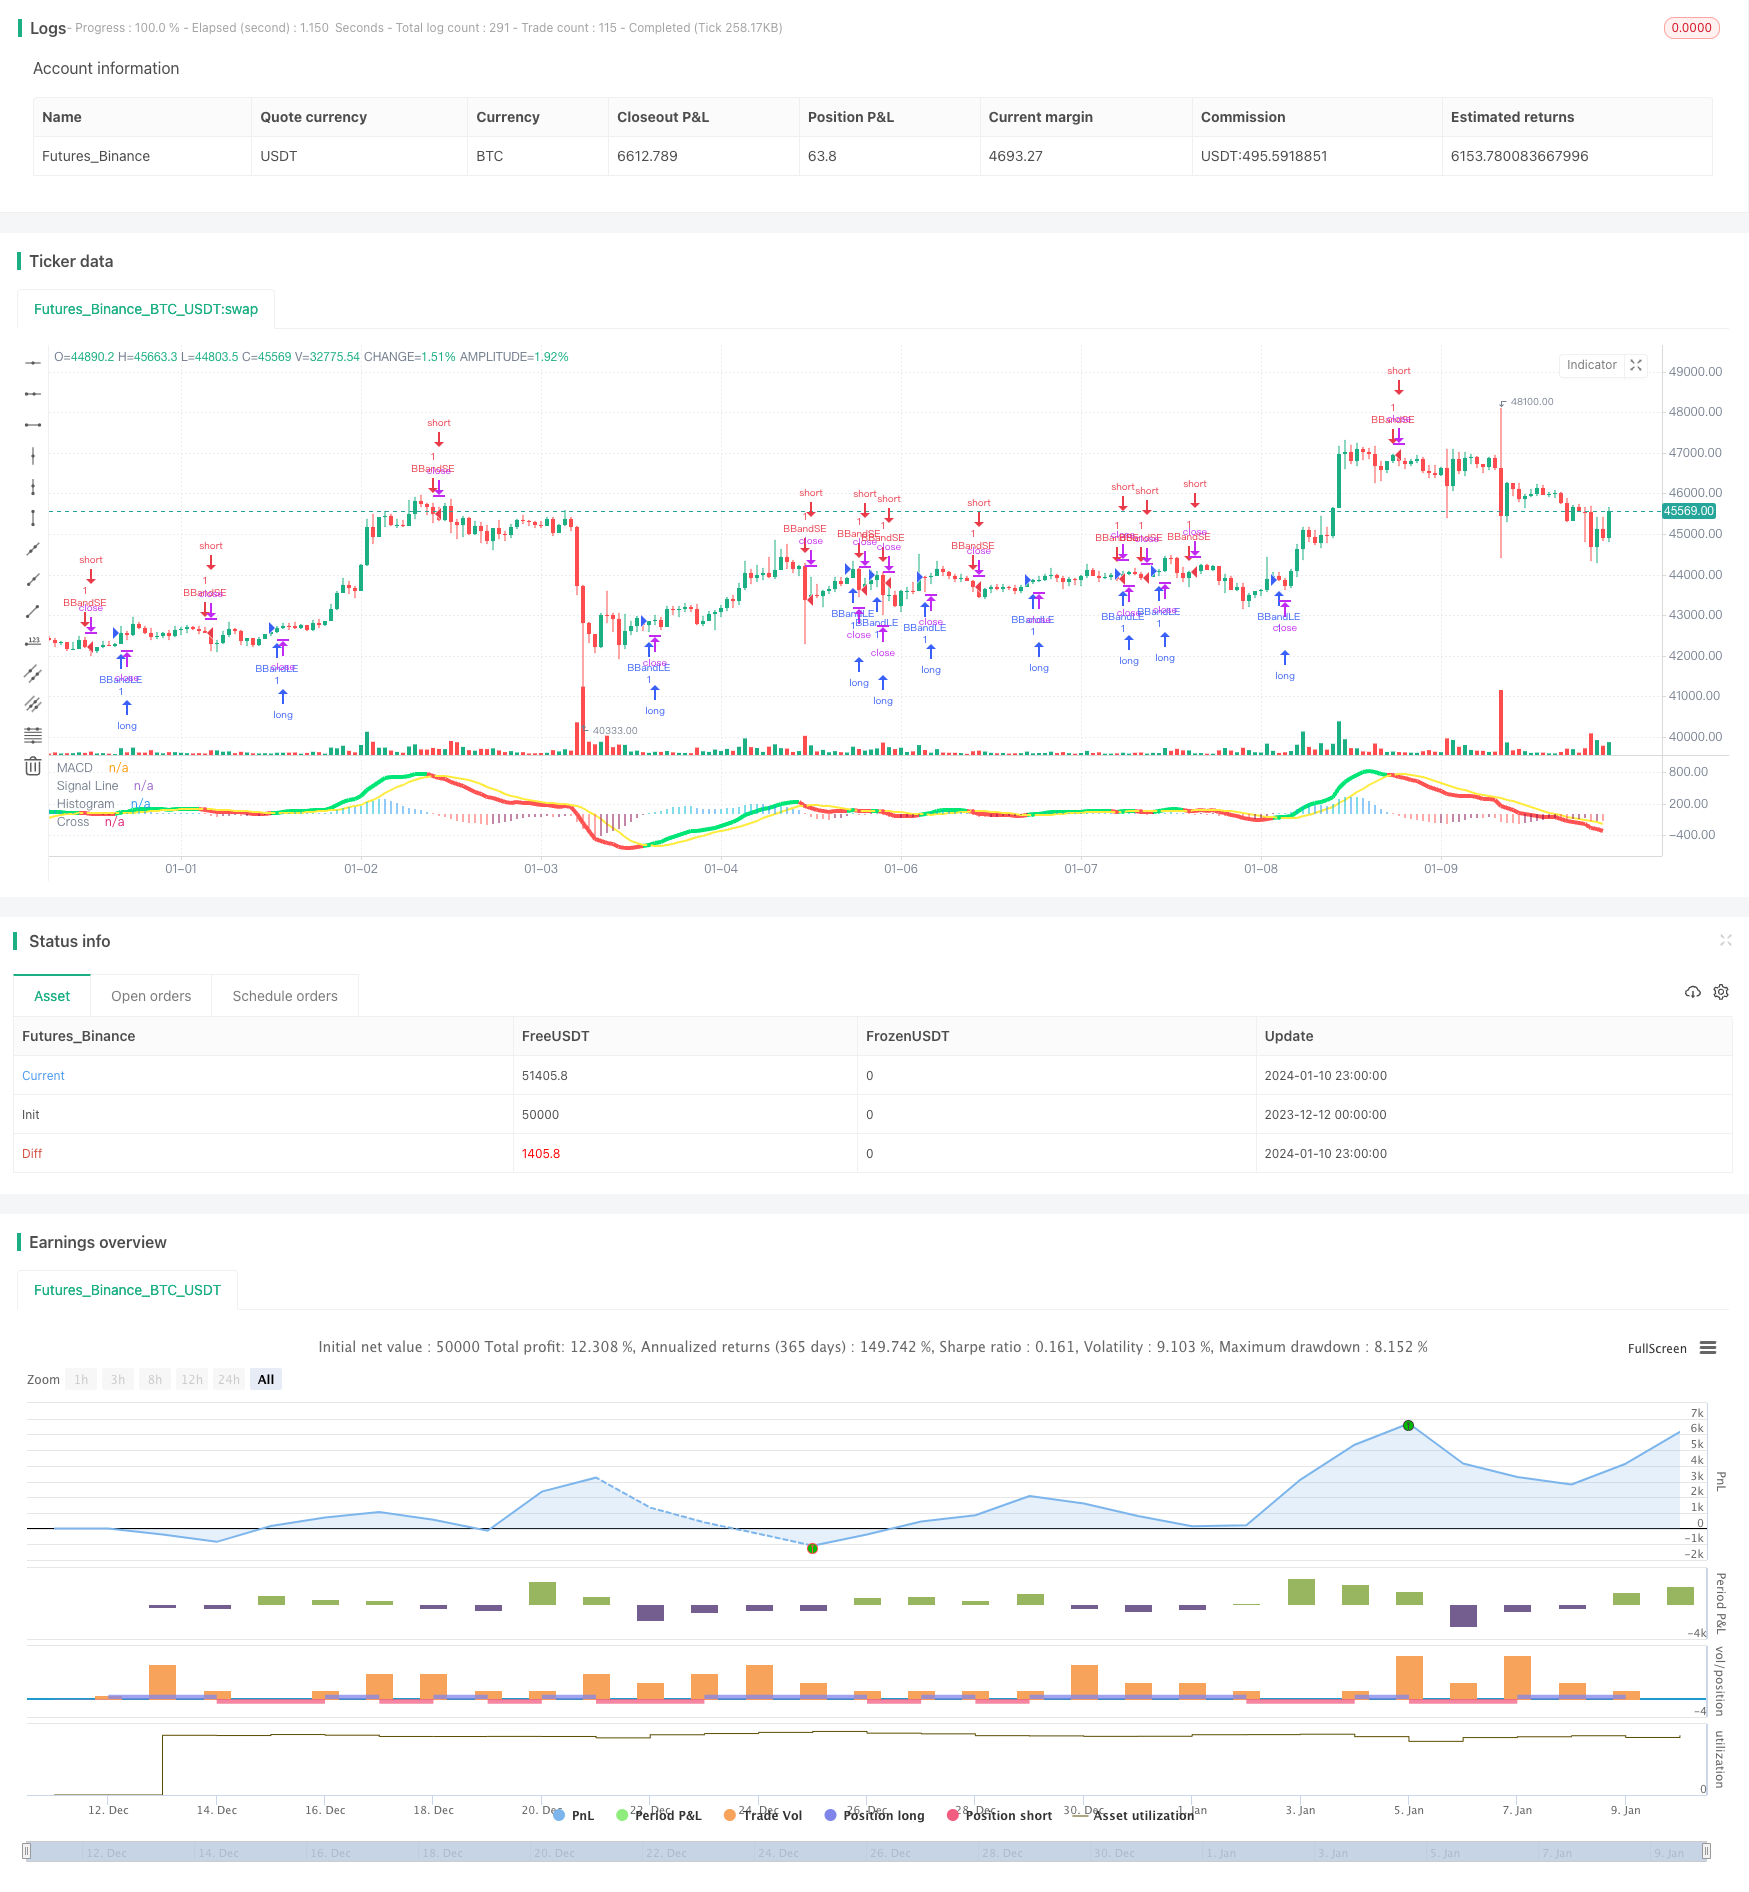
Overview: This strategy uses the MACD indicator to generate trading signals across multiple time frames to track trends. The core idea is to confirm the trend direction in higher time frames and then look for specific entry opportunities in lower time frames.
Strategy Principle: The strategy uses the crossovers between the MACD difference line and signal line to determine the trend direction. Specifically, it calculates the MACD difference and signal lines in higher time frames (default 60min). When the difference line crosses above the signal line, a buy signal is generated. When crossing below, a sell signal is generated to confirm the overall trend direction.
The strategy then calculates the MACD in lower time frames (current period) and enters positions when crossovers happen between the difference and signal lines. So higher time frames are used to judge trend direction and lower ones are used to find specific entry points.
The strategy also uses the color change of the MACD histogram to assist in judging the trend. Green bars indicate an uptrend while red bars indicate a downtrend.
Advantage Analysis: 1. Multi-timeframe design confirms trend in higher TF and finds entries in lower TF, improving systemacity.
Uses MACD crossovers to determine entries and exits, parameters optimized for reliable signals.
Histogram color assists in determining current trend status, improving decision accuracy.
Automatically tracks trends, reduces emotional errors.
Risk Analysis: 1. As a trend-following indicator for medium-long term trends, MACD can produce false signals in the short term leading to unnecessary losses.
Multi-timeframe strategies are harder to optimize and test as multiple periods need to be considered simultaneously.
No stop loss is set which poses the risk of large losses.
Optimization Directions: 1. Optimize MACD parameters to find best combinations.
Add stop loss to limit max loss.
Evaluate other filters to improve signal quality.
Test different time frame combinations to find optimal matches.
Summary: The strategy is well designed systemactically and combines multiple strengths of the MACD indicator to effectively track medium-long term trends. However, the lack of a stop loss mechanism means short term losses can easily expand, which needs to be improved. Overall, with strong trend following capabilities, the strategy provides a high-quality framework for stock picking and decision making in quantitative trading. Further optimizations in parameters and models can expand profit potential and improve stability.
/*backtest
start: 2023-12-12 00:00:00
end: 2024-01-11 00:00:00
period: 1h
basePeriod: 15m
exchanges: [{"eid":"Futures_Binance","currency":"BTC_USDT"}]
*/

//@author : SudeepBisht
//@version=2
strategy(title="SB_CM_MacD_Ult_MTF", shorttitle="SB_CM_Ult_MacD_MTF")
source = close
useCurrentRes = input(true, title="Use Current Chart Resolution?")
resCustom = input(title="Use Different Timeframe? Uncheck Box Above",  defval="60")
smd = input(true, title="Show MacD & Signal Line? Also Turn Off Dots Below")
sd = input(true, title="Show Dots When MacD Crosses Signal Line?")
sh = input(true, title="Show Histogram?")
macd_colorChange = input(true,title="Change MacD Line Color-Signal Line Cross?")
hist_colorChange = input(true,title="MacD Histogram 4 Colors?")

res = useCurrentRes ? timeframe.period : resCustom

fastLength = input(12, minval=1), slowLength=input(26,minval=1)
signalLength=input(9,minval=1)

fastMA = ema(source, fastLength)
slowMA = ema(source, slowLength)

macd = fastMA - slowMA
signal = sma(macd, signalLength)
hist = macd - signal

outMacD = request.security(syminfo.tickerid, res, macd)
outSignal = request.security(syminfo.tickerid, res, signal)
outHist = request.security(syminfo.tickerid, res, hist)

histA_IsUp = outHist > outHist[1] and outHist > 0
histA_IsDown = outHist < outHist[1] and outHist > 0
histB_IsDown = outHist < outHist[1] and outHist <= 0
histB_IsUp = outHist > outHist[1] and outHist <= 0

//MacD Color Definitions
macd_IsAbove = outMacD >= outSignal
macd_IsBelow = outMacD < outSignal

plot_color = hist_colorChange ? histA_IsUp ? aqua : histA_IsDown ? blue : histB_IsDown ? red : histB_IsUp ? maroon :yellow :gray
macd_color = macd_colorChange ? macd_IsAbove ? lime : red : red
signal_color = macd_colorChange ? macd_IsAbove ? yellow : yellow : lime

circleYPosition = outSignal

plot(smd and outMacD ? outMacD : na, title="MACD", color=macd_color, linewidth=4)
plot(smd and outSignal ? outSignal : na, title="Signal Line", color=signal_color, style=line ,linewidth=2)
plot(sh and outHist ? outHist : na, title="Histogram", color=plot_color, style=histogram, linewidth=4)
plot(sd and cross(outMacD, outSignal) ? circleYPosition : na, title="Cross", style=circles, linewidth=4, color=macd_color)
// hline(0, '0 Line', linestyle=solid, linewidth=2, color=white)

macd_chk=smd and outMacD ? outMacD : na
checker=smd and outSignal ? outSignal : na
if (crossover(macd_chk,checker))
    strategy.entry("BBandLE", strategy.long, comment="BBandLE")

if (crossunder(macd_chk, checker))
    strategy.entry("BBandSE", strategy.short, comment="BBandSE")