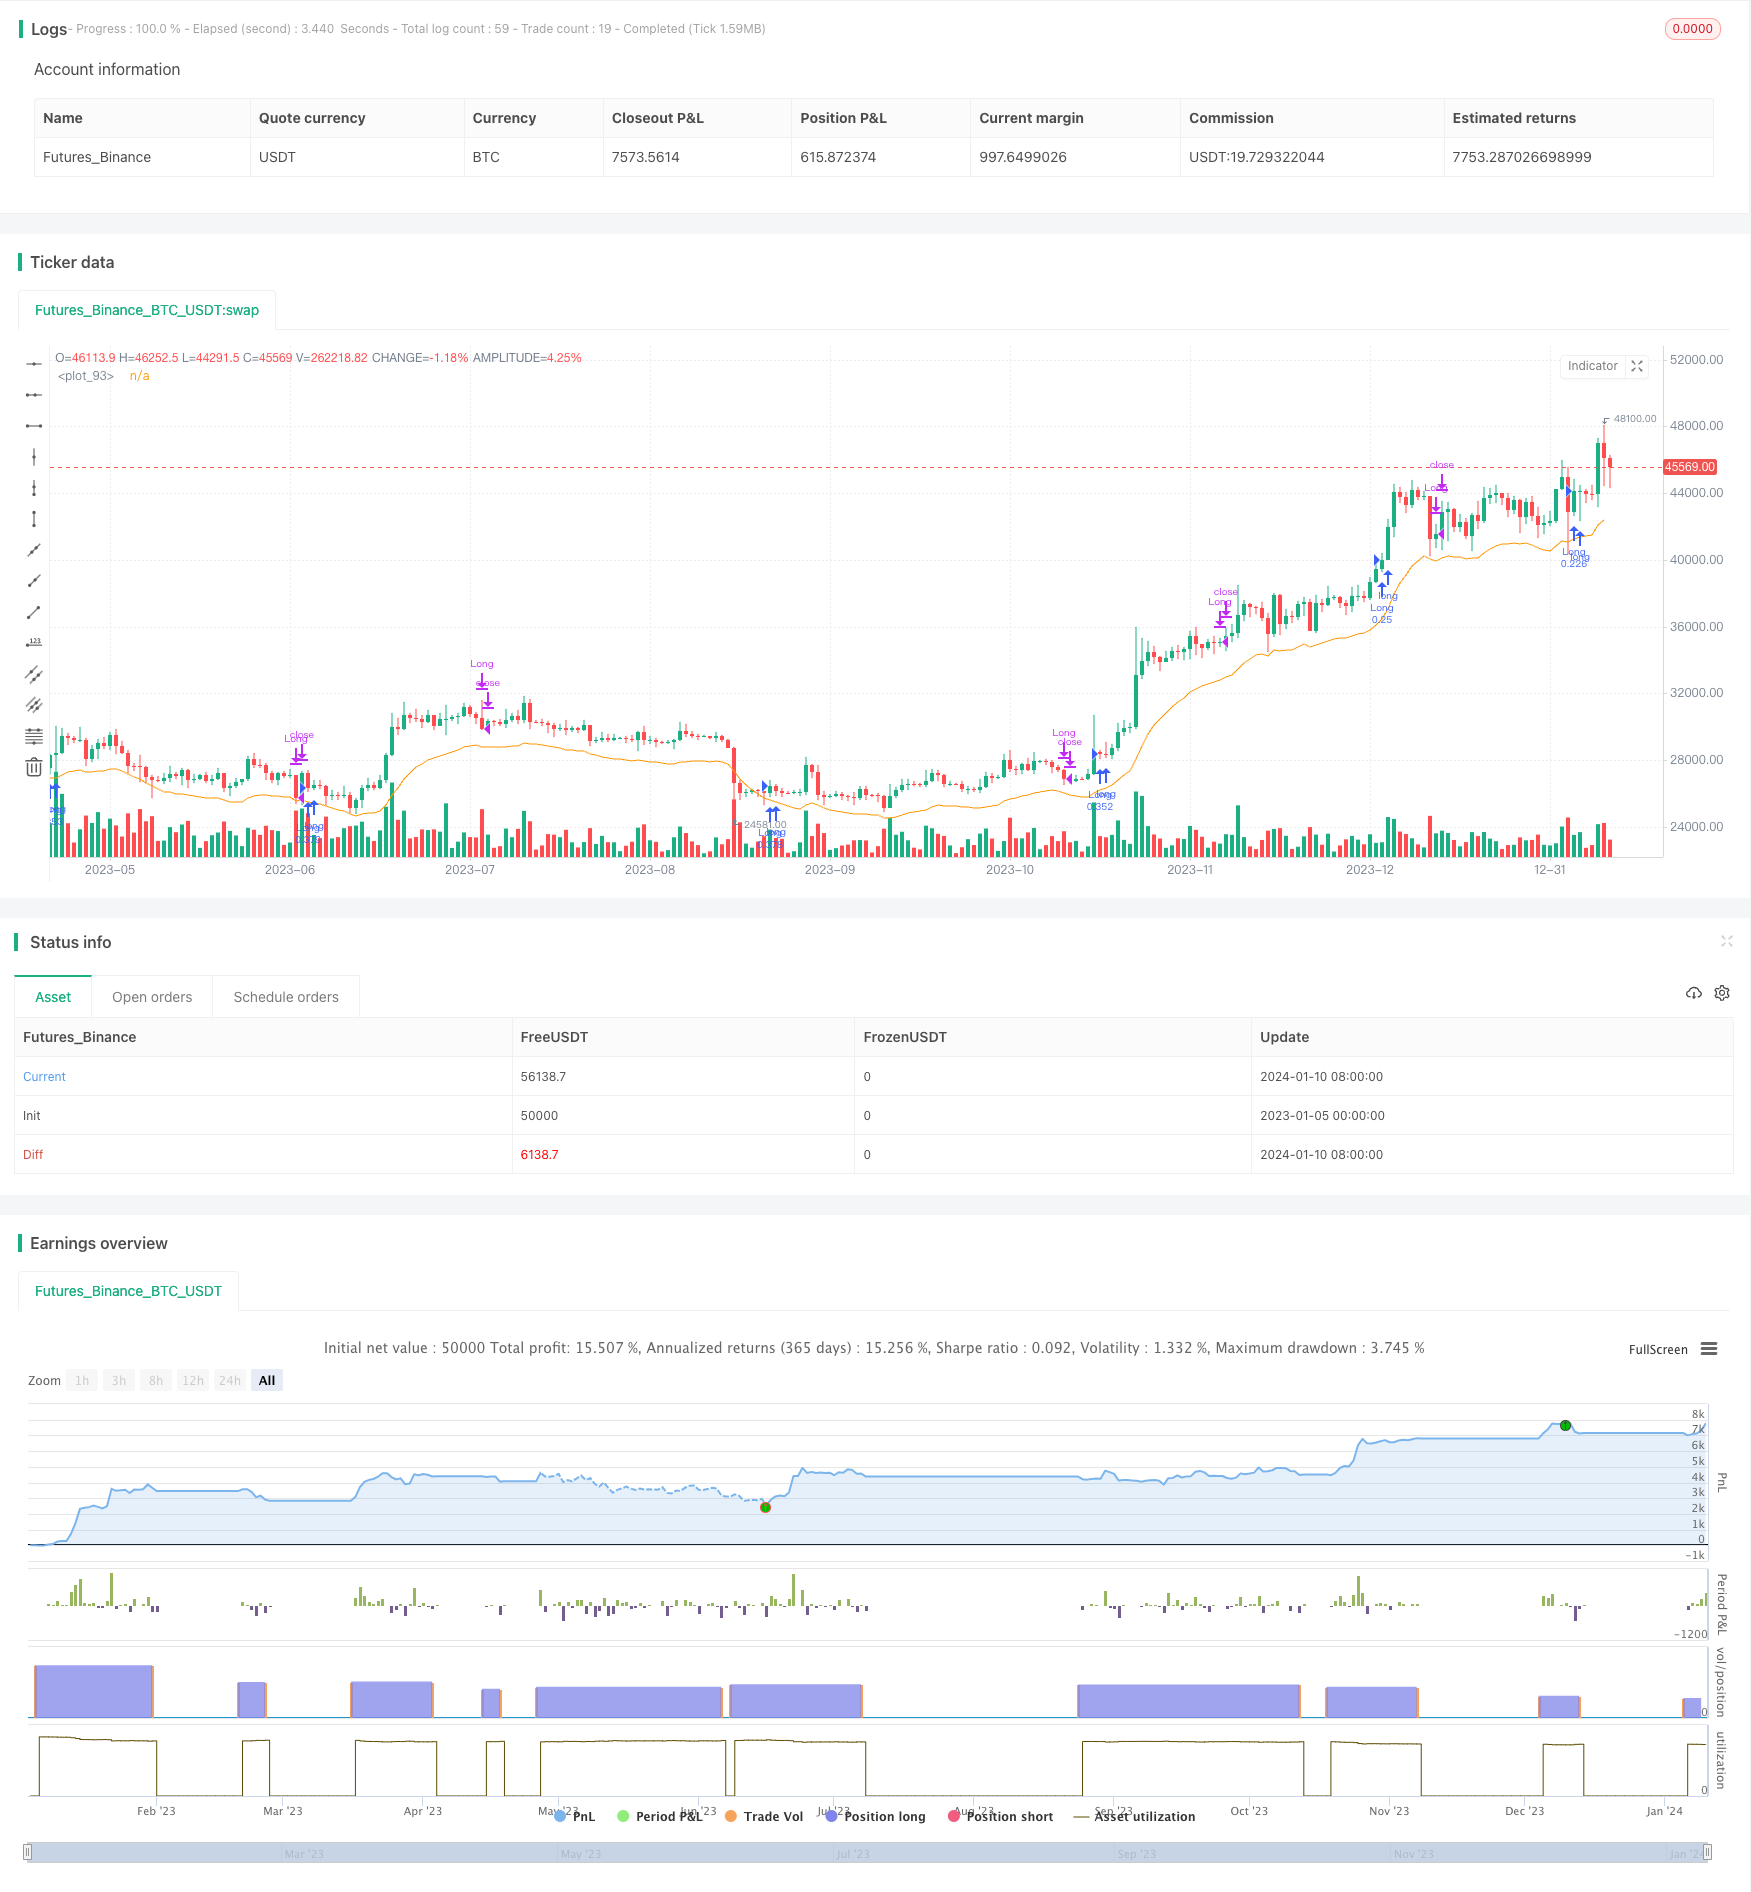
Overview
The Dual MACD Reversal Trading Strategy is a quantitative trading strategy that uses the MACD indicator to identify trend reversal signals. This strategy also combines the RVI indicator and the CCI indicator to confirm buy signals and filter out some false reversals. This strategy is suitable for intraday and short-term trading.
Strategy Logic
The strategy is mainly based on the MACD indicator. MACD is the fast moving average EMA(12) minus the slow moving average EMA(26) to get the fast line, and then use SIGNAL(9) as the slow line. When the fast line crosses above the slow line to generate a Golden Cross, it is bullish; When the fast line crosses below the slow line to generate a Dead Cross, it is bearish.
This strategy uses dual time frame MACD indicators to identify reversal opportunities. The strategy uses the 6-hour MACD to determine the overall trend direction and the 1-hour MACD to find reversal signals. When the 6-hour MACD is in an uptrend, if the 1-hour fast line crosses below the slow line to generate a death cross signal, it indicates that the price may reverse upwards. At this point, combine the RVI indicator and CCI indicator to further confirm and generate a buy signal.
The RVI indicator measures the relationship between the closing price and opening price of the most recent few candlesticks versus the highest and lowest prices. An RVI below 0.2 is considered oversold. The CCI indicator below -100 indicates oversold. So the strategy uses the RVI indicator below 0.2 and the CCI indicator below -95 to help confirm the buy signal.
Advantage Analysis
This strategy combines dual time frame MACD and RVI and CCI indicators to accurately identify reversal opportunities and filter out some false reversal signals to improve the stability of the strategy. The specific advantages are as follows:
Use the 6-hour MACD to determine the major trend and avoid trading in environments with increased uncertainty in the broader market.
The 1-hour MACD identifies reversal timing and captures shorter cycle price adjustments.
The combination of the RVI indicator and CCI indicator can more accurately determine the timing of the reversal.
The strategy incorporates a stop loss to reduce losses.
Risk Analysis
The strategy also has some risks, mainly reflected in:
MACD itself tends to generate false signals, so even though the auxiliary indicators have a good filtering effect, it is impossible to completely avoid losses. It is recommended to reduce the position size.
RVI and CCI indicators may issue incorrect signals, thus missing better reversal opportunities or increasing unnecessary losses. It is recommended to reasonably adjust RVI and CCI parameters.
Improper stop loss setting may trigger stop loss too frequently or fail to control losses in time if too loose. It is recommended to adjust the stop loss magnitude according to market volatility.
Optimization Directions
The strategy can be further optimized from the following aspects:
Currently using 1 hour and 6 hour two time frames, more time frame combinations can be tested to find more stable parameters.
More indicators can be introduced, such as KDJ, WR, OBV, etc. to assist in judging trading points. But be careful not to generate overly complex trading signals.
Parameters can be continuously optimized for different varieties, and parameter libraries can be established. For varieties suitable for medium and low frequency trading, longer cycle parameters can be appropriately increased.
A dynamic stop loss mechanism can be set to gradually move the stop loss point as profits increase. Or adjust the stop loss magnitude in real time according to market volatility.
Summary
The Dual MACD Reversal Trading Strategy comprehensively considers trend judgment and reversal signals, and is assisted by RVI and CCI indicators to filter signals. This strategy can effectively identify short-term adjustments with good risk-return ratios, suitable for intraday and short-term trading, and can also be used as part of a multi-strategy portfolio to provide overall strategy diversity.
/*backtest
start: 2023-01-05 00:00:00
end: 2024-01-11 00:00:00
period: 1d
basePeriod: 1h
exchanges: [{"eid":"Futures_Binance","currency":"BTC_USDT"}]
*/

//@version=3
strategy("Bat MACD", overlay=true)

fastLength = input(12)
slowlength = input(26)
MACDLength = input(9)
h=1.05

MACD = ema(close, fastLength) - ema(close, slowlength)
aMACD = ema(MACD, MACDLength)
delta = MACD - aMACD
hmacd= aMACD>0? h*aMACD: -(1/h)*abs(MACD)

MACDD= (request.security(syminfo.tickerid,'360',ema(close, fastLength)) - request.security(syminfo.tickerid,'360',ema(close,slowlength)))
aMACDD = (request.security(syminfo.tickerid,'360',ema(ema(request.security(syminfo.tickerid,'360',close), fastLength)-ema(request.security(syminfo.tickerid,'360',close),slowlength), MACDLength)))
deltad= MACDD-aMACDD
L= input(0.95, title="SL")
SL = L*ema(close,10)

//MACD
slow = input(26,"Short period")
fast = input(12, "Long period")
signal = input(9, "Smoothing period")
//MACD = ema(close,fast)-ema(close,slow)
dMACD= MACD<0? ema(MACD,5):0
Mcond= rising(dMACD,1)
mcount=0.0
mcount := Mcond ? nz(mcount[1]) + 1 : nz(mcount[1])
counter=0
counter := (mcount-mcount[1]==0) ? nz(counter[1]) + 1 : 0
//counter := counter==3 ? 0: nz(counter[1])
pp=0.0
mc=0.0
pp:= (counter-counter[1]<0)? close[1] : nz(pp[1])
mc:= (counter-counter[1]<0)? MACD[1] : nz(mc[1])

bull = (pp-pp[1]<-close*0.005 and mc-mc[1]>0.02*abs(MACD) and MACD<0 and MACD[1]<0)? 1:0

//bgcolor(bull?green:white)
//RVI
p=10
CO=close-open
HL=high-low
value1 = (CO + 2*CO[1] + 2*CO[2] + CO[3])/6
value2 = (HL + 2*HL[1] + 2*HL[2] + HL[3])/6
num=sum(value1,p)
denom=sum(value2,p)
rvi=denom!=0?num/denom:0

//RVI
drvi= (rvi<0.2)? ema(rvi-0.20,3):0
RVcond= rising(drvi,1)
rvcount=0.0
rvcount := RVcond ? nz(rvcount[1]) + 1 : nz(rvcount[1])
rvcounter=0
rvcounter := (rvcount-rvcount[1]==0) ? nz(rvcounter[1]) + 1 : 0
//counter := counter==3 ? 0: nz(counter[1])
rvpp=0.0
rvmc=0.0
rvpp:= (rvcounter-rvcounter[1]<0)? close[1] : nz(rvpp[1])
rvmc:= (rvcounter-rvcounter[1]<0)? drvi[1] : nz(rvmc[1])
rvbull = (rvpp-rvpp[1]<-close*0.005 and rvmc-rvmc[1]>0.02 and drvi<0 and drvi[1]<0)? 1:0

//VolCCI
length1 = input(10, minval=1)
xMAVolPrice = ema(volume * close, length1)
xMAVol = ema(volume, length1)
src1 = xMAVolPrice / xMAVol
map = sma(src1, length1)
cci = (src1 - map) / (0.015 * dev(src1, length1))
cfi= (cci<0)? ema(cci,3) :0
CCcond= rising(cfi,1)
cccount=0.0
cccount := CCcond ? nz(cccount[1]) + 1 : nz(cccount[1])
cccounter=0
cccounter := (cccount-cccount[1]==0) ? nz(cccounter[1]) + 1 : 0
//counter := counter==3 ? 0: nz(counter[1])
ccpp=0.0
ccmc=0.0
ccpp:= (cccounter-cccounter[1]<0)? close[1] : nz(ccpp[1])
ccmc:= (cccounter-cccounter[1]<0)? cci[1] : nz(ccmc[1])
ccbull = (ccpp-ccpp[1]<-close*0.003 and ccmc-ccmc[1]>20 and cci<-95 and cci[1]<-95)? 1:0

A= bull+ccbull+rvbull
if ((MACD>hmacd)  and deltad>0 and delta>delta[1])
    strategy.entry("Long", strategy.long, comment="Buy", qty=10000/close)
if (crossunder(delta, 0) or crossunder(close,SL))
    strategy.close("Long")
if(crossover(low,SL) and SL-SL[1]<close*0.005 and SL-SL[1]>-close*0.005)
    strategy.entry("Long", strategy.long, comment="Buy", qty=10000/close)
if A
    strategy.entry("Long", strategy.long, comment="Buy", qty=10000/close)
plot(SL)

//plot(strategy.equity, title="equity", color=red, linewidth=2, style=areabr)