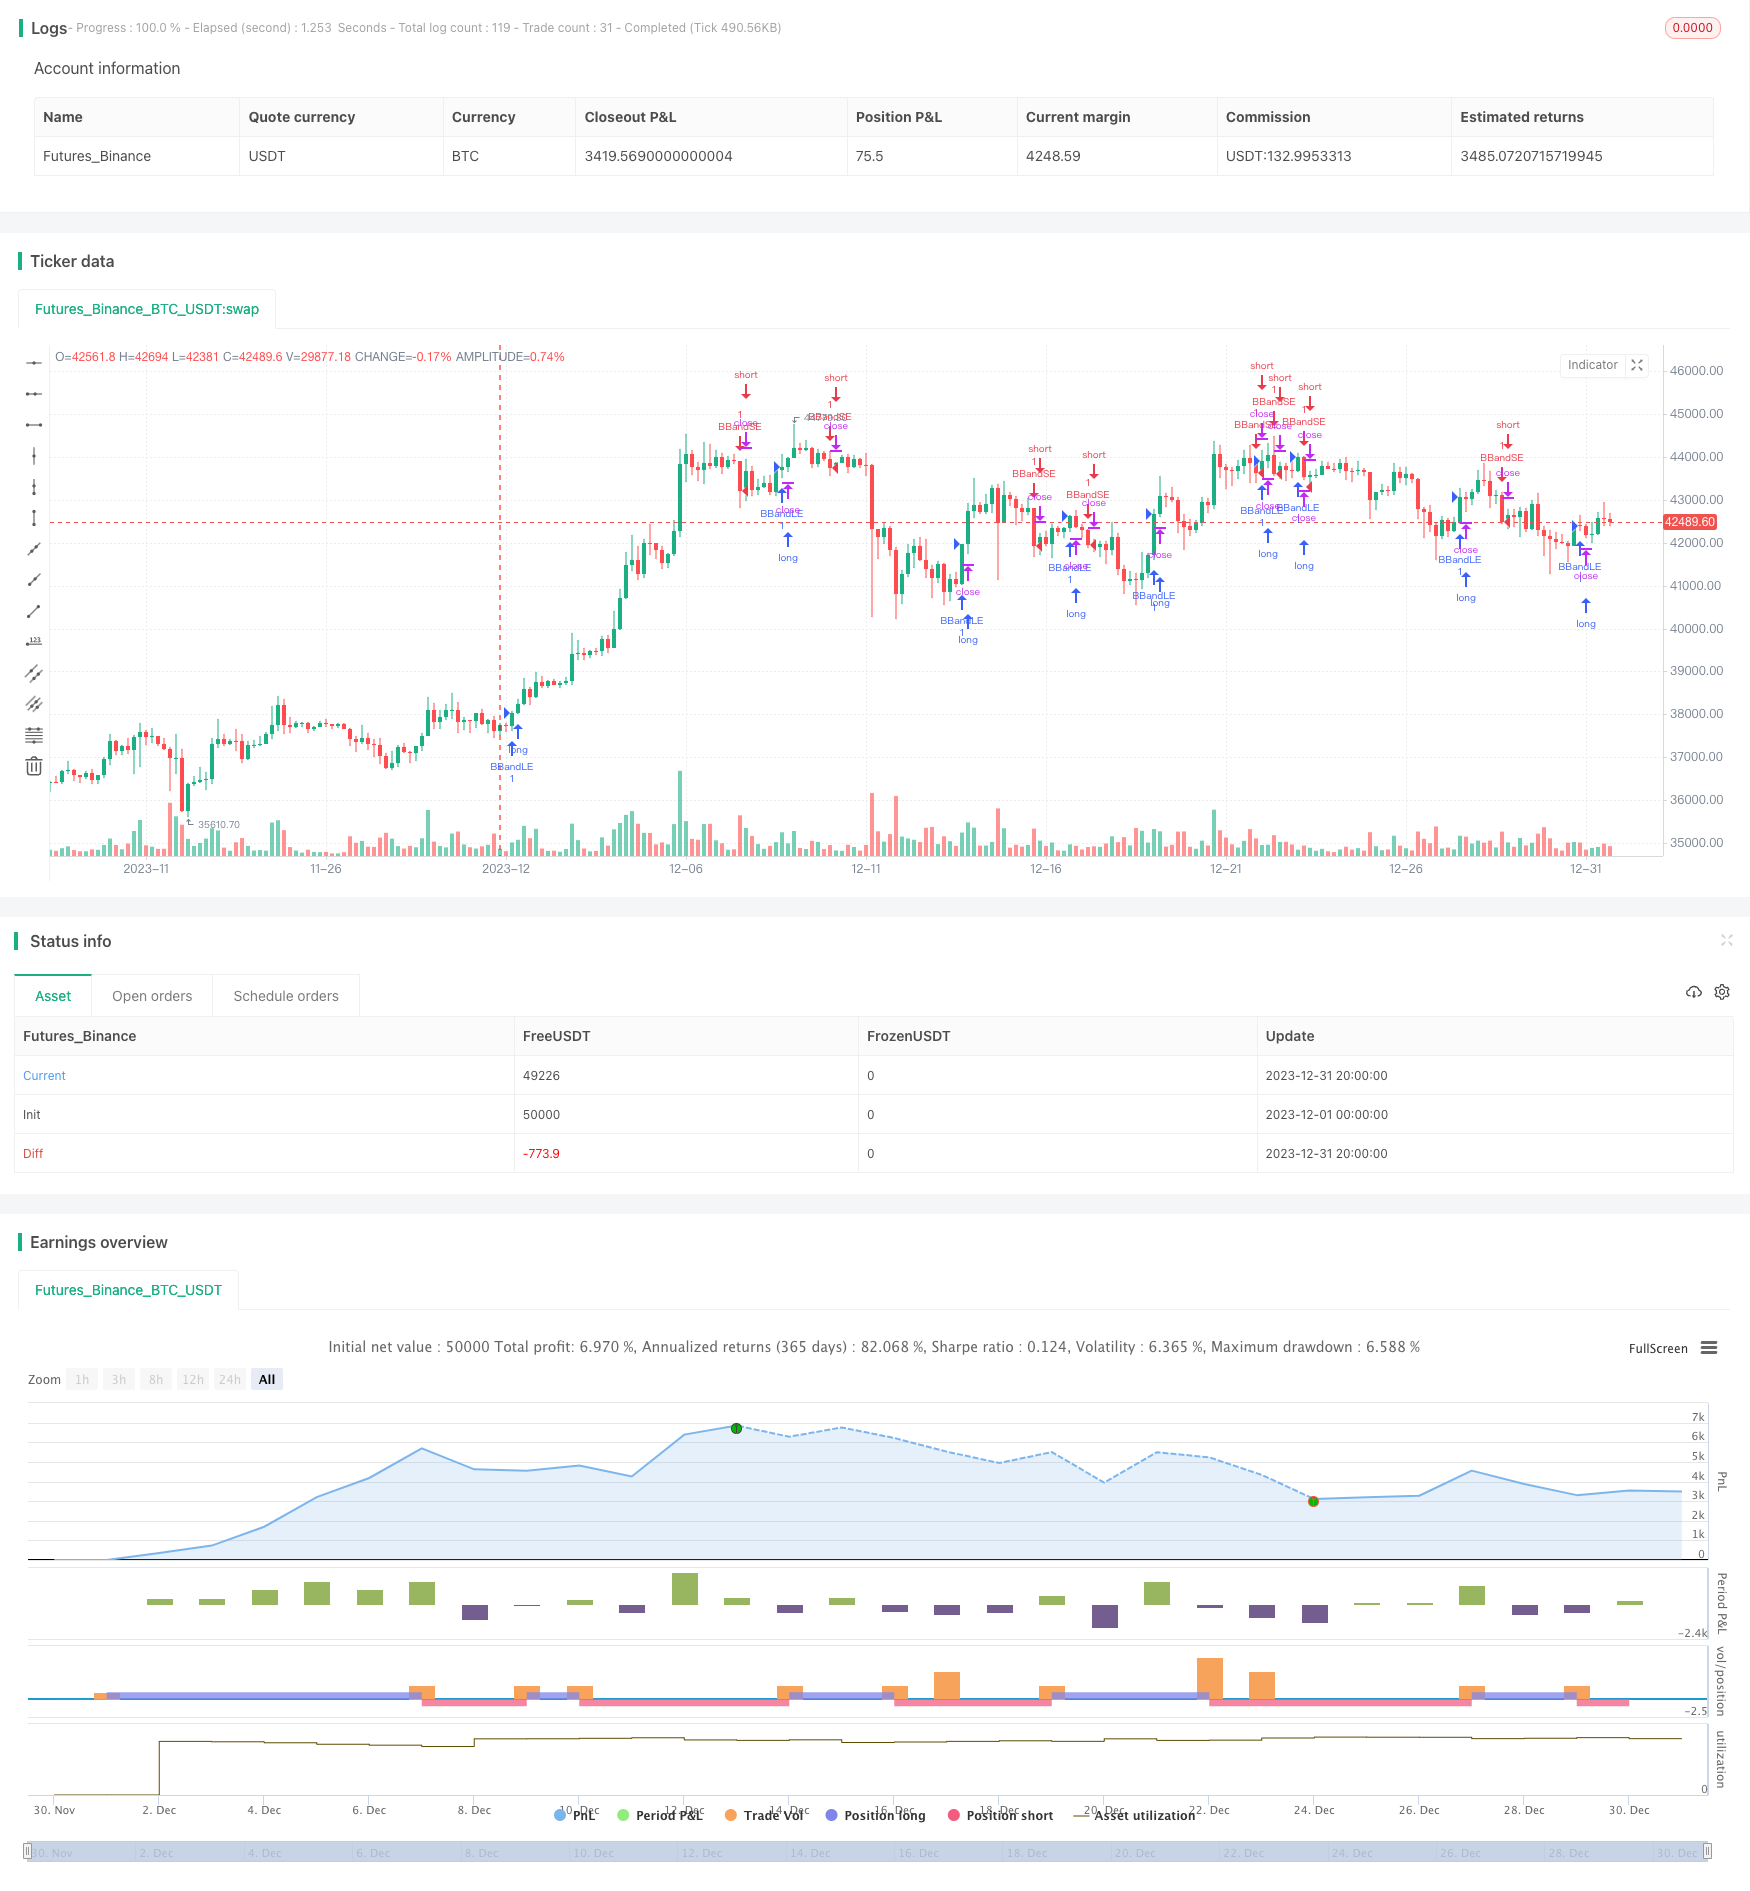
Overview
This is a trend-following strategy based on Bollinger Bands. It uses the upper and lower bands of Bollinger Bands to determine price trends and generate buy and sell signals. Specifically, it goes long when the close price breaks above the upper band and goes short when the close price breaks below the lower band.
Strategy Logic
The strategy uses the upper and lower bands of Bollinger Bands to determine trends. The middle band of Bollinger Bands is the Simple Moving Average of the close prices over n periods. The width of the bands is k times the standard deviation of close prices over n periods. The formulas are:
Middle Band: SMA(Close, n) Upper Band: Middle Band + k * STDEV(Close, n) Lower Band: Middle Band - k * STDEV(Close, n)
When price breaks above the upper band, it means that price has exceeded the normal fluctuation range around the middle band, indicating an uptrend. When price breaks below the lower band, it means price has fallen outside the normal range, indicating a downtrend.
Based on this, the strategy determines:
- Go long when close price breaks above the upper band
- Go short when close price breaks below the lower band
Using Bollinger Bands to determine trends works well for medium to long term trends.
Advantage Analysis
The main advantages of this strategy are:
Using Bollinger Bands to determine trends is reliable. Bollinger Bands considers volatility and can determine turning points well.
The strategy rules are simple and clear, easy to understand and implement.
No need to predict prices, just track the relationship between price and Bollinger Bands. Easy to operate.
Signals are generated on band breaks, capturing trend shifts timely without missing opportunities.
Risk Analysis
The strategy also has some risks:
Bollinger Bands cannot fully predict price movements. Post band breakout, trends may not sustain and whipsaws are possible.
Price may oscillate near bands, causing multiple small losses.
Inadequate parameter settings may also lead to bad signals. A n that’s too small may cause too frequent bands changes and signals. A k too large may lead to lagging signals.
Market trends could impact individual stocks and lead to systemic risks.
Corresponding risk control measures:
- Adjust n and k appropriately to balance sensitivity.
- Use stops to control losses on single trades.
- Add filters with other indicators to filter signals.
Optimization Directions
The strategy can be optimized in several ways:
Optimize n and test different settings. Also make k dynamic based on volatility.
Add filters using other indicators like MACD and KDJ to filter buy/sell signals and reduce false signals.
Add stop loss mechanisms like price based or volatility based stops to control losses.
Use Bollinger bandwidth to determine price volatility and adjust position sizes. Wider bands indicate higher volatility so reduce sizes.
Combine with trend determining indicators and use bands for entry signals in established trends.
Summary
Overall this is a reliable trend following strategy. It uses Bollinger Bands to determine trends and is simple to operate. Main advantages are timely signals capturing shifts in trend. But some whipsaws and parameter optimization difficulties exist. Methods like parameter optimization, adding filters can control risks and improve stability. It suits investors who have moderate trend accuracy needs and prefer high operation frequency.
/*backtest
start: 2023-12-01 00:00:00
end: 2023-12-31 23:59:59
period: 4h
basePeriod: 15m
exchanges: [{"eid":"Futures_Binance","currency":"BTC_USDT"}]
*/

//@version=4
strategy("Bollinger Bands Trend Strategy", shorttitle="BB Trend", overlay=true)
source = close
length = input(8, minval=1)
mult = input(1.00, minval=0.001, maxval=50)

basis = sma(source, length)
dev = mult * stdev(source, length)

upper = basis + dev
lower = basis - dev

buyEntry = crossover(source, upper)
sellEntry = crossunder(source, lower)

if (crossover(source, upper))
    strategy.entry("BBandLE", strategy.long, stop=upper, oca_name="BollingerBands",  comment="BBandLE")
else
    strategy.cancel(id="BBandLE")

if (crossunder(source, lower))
    strategy.entry("BBandSE", strategy.short, stop=lower, oca_name="BollingerBands", comment="BBandSE")
else
    strategy.cancel(id="BBandSE")

//plot(strategy.equity, title="equity", color=color.red, linewidth=2, style=plot.style_areabr)