A Trend Reversal Strategy Based on Moving Averages, Price Patterns and Volume
Author: ChaoZhang, Date: 2024-01-17 17:48:40Tags:

Overview
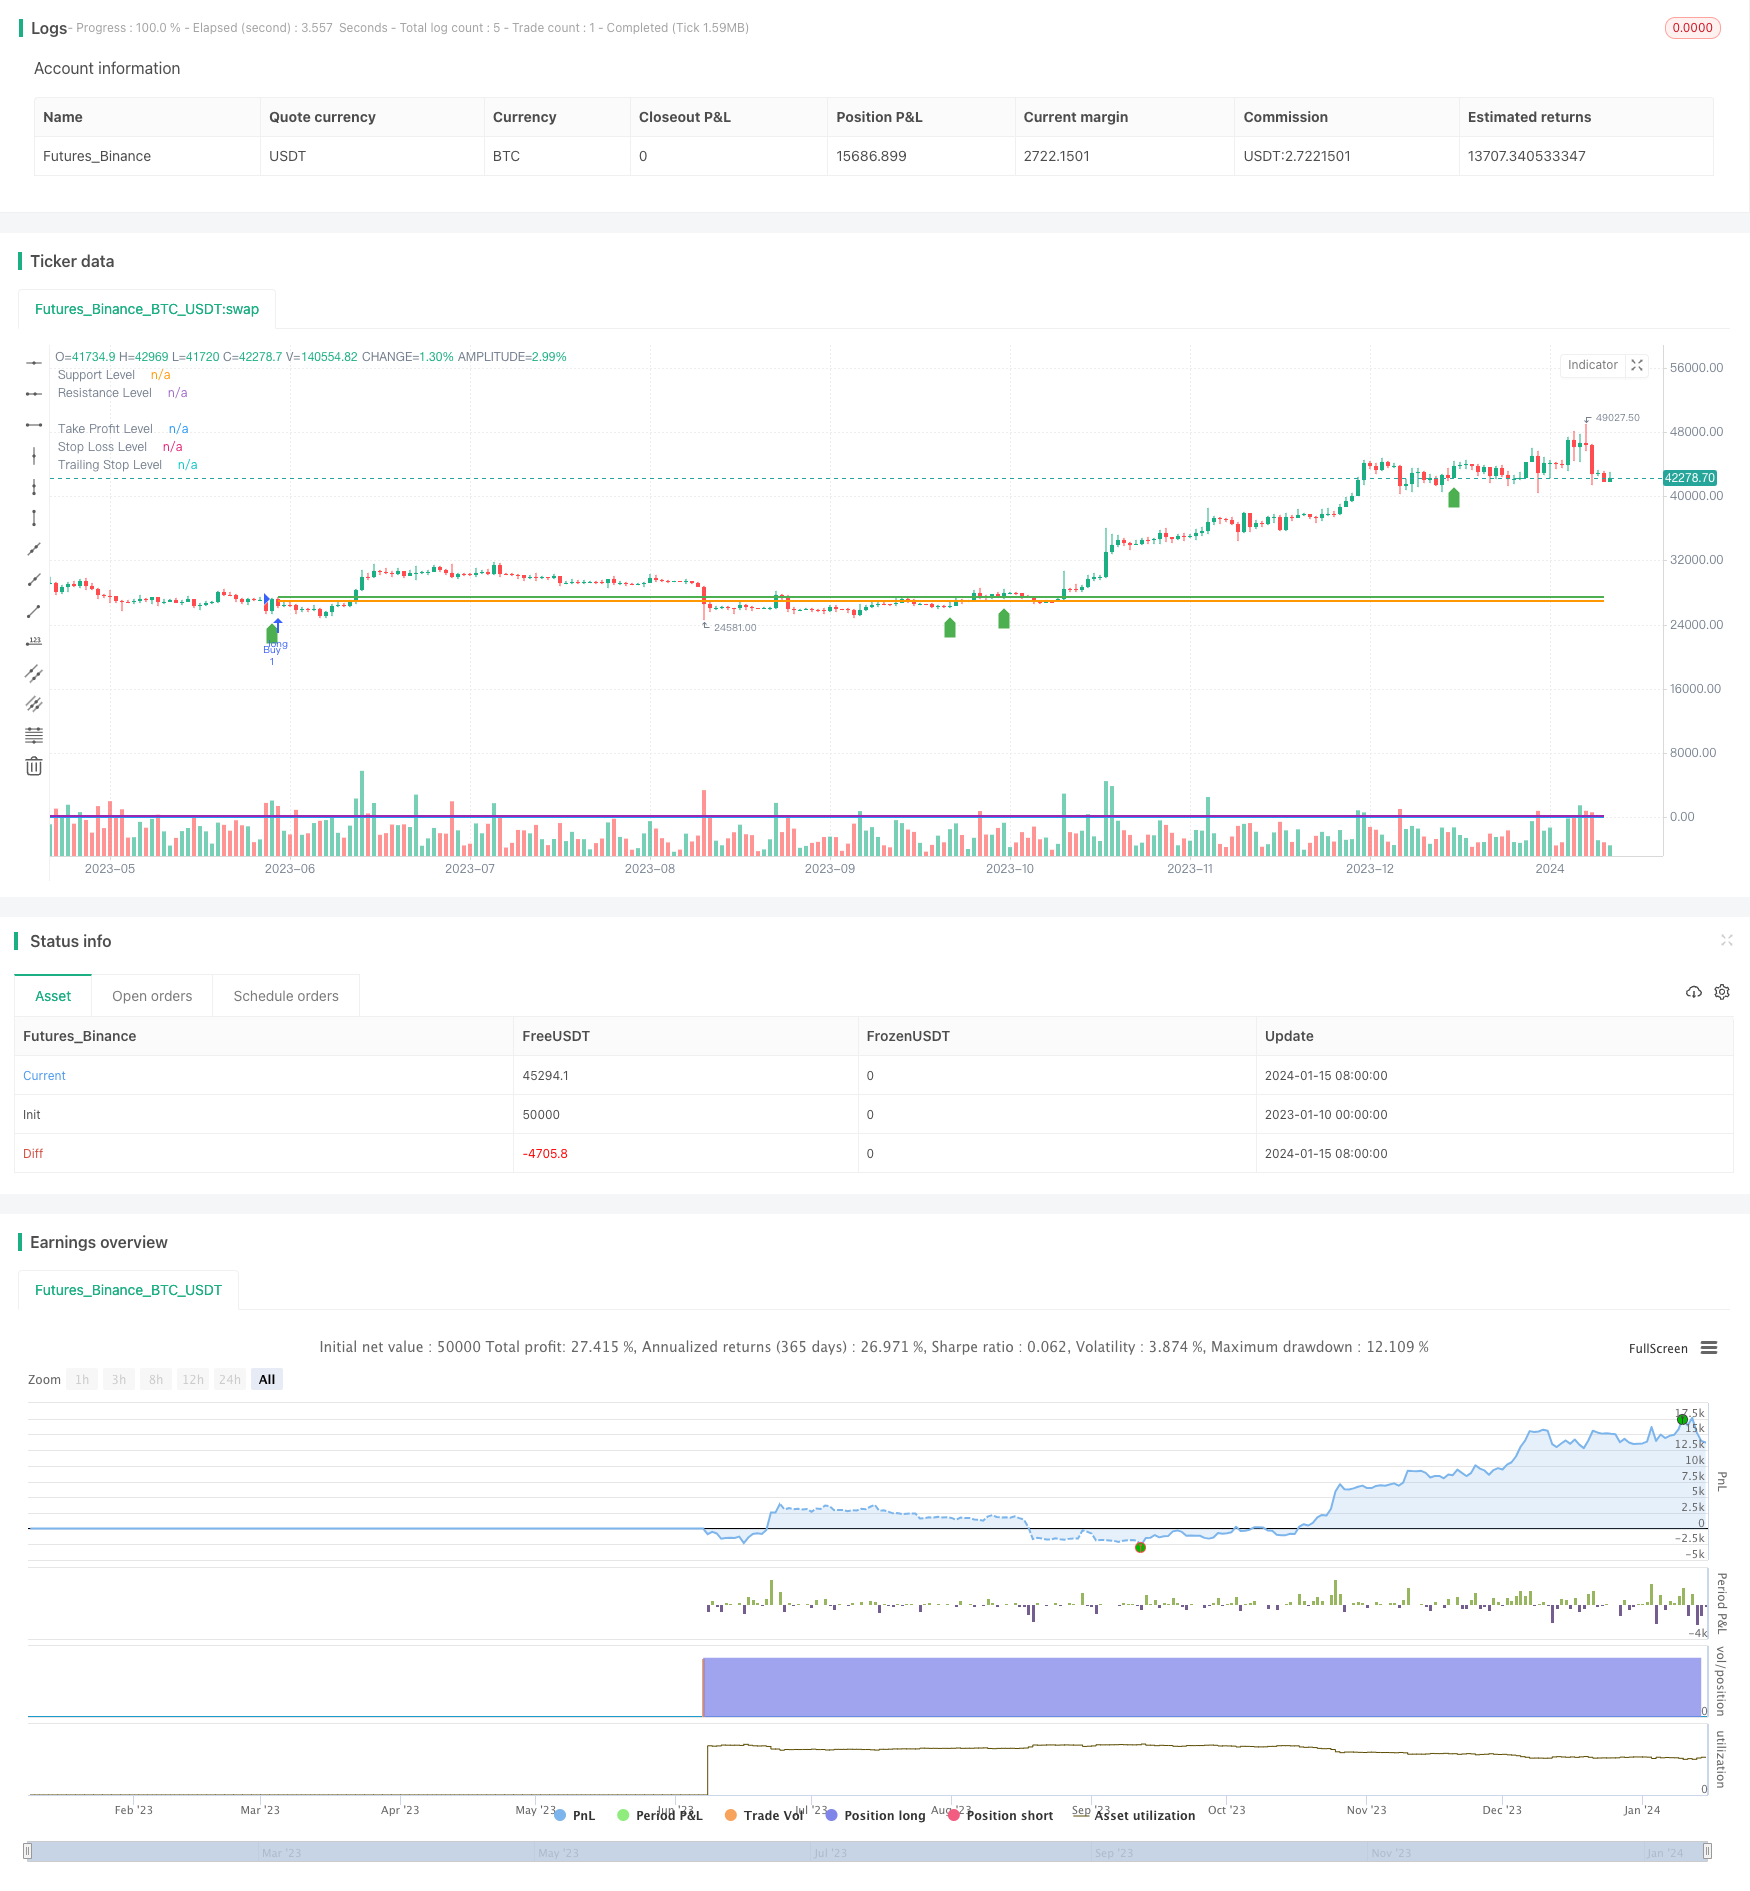
This strategy combines moving averages, price patterns and volume to identify potential trend reversal points in the market. It goes long when the fast moving average crosses above the slow moving average, a bullish engulfing pattern appears, resistance level breaks, and trading volume surges. It goes short when the opposite conditions occur.
Principles
The core idea of this strategy is to use a combination of moving averages, price action patterns and volume as signals for upcoming reversals. Specifically, golden crosses and death crosses of moving averages can indicate shifts in trend. Bullish/bearish engulfing patterns usually imply short-term reversals ahead. Surges in trading volume also often signify trend reversals. By combining all three types of signals, the strategy aims to accurately capture reversal turning points.
In terms of logic, the strategy first calculates fast and slow moving averages. Then it defines conditions to identify bullish/bearish engulfing patterns. Support and resistance levels are incorporated along with volume expansion as additional conditions. The buy signals trigger when the fast MA crosses above the slow MA, a bullish pattern appears, resistance breaks, and volume surges. The opposite conditions trigger sell signals.
Advantages
The biggest advantage of this strategy is using a combination of multiple signals to confirm reversals, which helps avoid false signals. Relying solely on a single indicator like moving averages or candlestick patterns tends to produce erroneous trades. By requiring alignment of all three factors, the likelihood of accurately capturing reversals improves significantly.
Additionally, this strategy utilizes both trend and reversal concepts. Reversals are only sought after an existing trend. In other words, the strategy only looks for countertrend retracements within trending markets. This helps reduce randomness and boosts profitability.
Risks
The biggest risk of this strategy is failed reversals, where the price continues moving against the trade direction after entry signals. This typically happens when the reversal signals turn out to be false, or only short-term corrections within a persisting trend.
The solutions include adjusting moving average periods to define better trends, using wider stop losses, and incorporating more confirmation factors before trading reversal signals. Adding filters based on higher timeframe trends could also help avoid false breakout trades.
Enhancements
Possible optimization avenues for this strategy include:
-
Tuning moving average periods to identify optimal long/short term trends.
-
Testing different support/resistance calculation methods like Pivot Points.
-
Trying other volume indicators like Chaikin Money Flow, Volume Oscillator.
-
Incorporating more reversal confirmation factors like long-term chart patterns, huge volume spikes etc.
-
Using stock index futures to cross-verify signals across markets.
Through rigorous testing of parameter combinations, further improvements in performance can be achieved.
Conclusion
This strategy neatly combines moving averages, price action and volume to trade reversals only in trending markets. By optimizing the parameters and adding more signal confirmations, it can become a robust system for short-term countertrend trading.
/*backtest
start: 2023-01-10 00:00:00
end: 2024-01-16 00:00:00
period: 1d
basePeriod: 1h
exchanges: [{"eid":"Futures_Binance","currency":"BTC_USDT"}]
*/

//@version=5
strategy("Profit Table Strategy", overlay=true)

// Input parameters
fastLength = input(10, title="Fast MA Length")
slowLength = input(20, title="Slow MA Length")
takeProfitPercent = input(1, title="Take Profit (%)") / 100
stopLossPercent = input(1, title="Stop Loss (%)") / 100
trailingStopPercent = input(1, title="Trailing Stop (%)") / 100

// Price action conditions
bullishEngulfing = close > open and close > open[1] and open < close[1] and open[1] > close[1]
bearishEngulfing = close < open and close < open[1] and open > close[1] and open[1] < close[1]

// Support and resistance levels
supportLevel = input(100, title="Support Level")
resistanceLevel = input(200, title="Resistance Level")

// Volume conditions
volumeCondition = volume > ta.sma(volume, 20)

// Calculate moving averages
fastMA = ta.sma(close, fastLength)
slowMA = ta.sma(close, slowLength)

// Buy condition
buyCondition = (fastMA > slowMA) and (close > resistanceLevel) and bullishEngulfing and volumeCondition

// Sell condition
sellCondition = (fastMA < slowMA) and (close < supportLevel) and bearishEngulfing and volumeCondition

// Strategy logic
strategy.entry("Buy", strategy.long, when=buyCondition)
strategy.close("Buy", when=sellCondition)

// Calculate take profit, stop loss, and trailing stop levels
takeProfitLevel = strategy.position_avg_price * (1 + takeProfitPercent)
stopLossLevel = strategy.position_avg_price * (1 - stopLossPercent)
trailingStopLevel = strategy.position_avg_price * (1 - trailingStopPercent)

// Plotting levels on the chart
plot(supportLevel, color=color.blue, style=plot.style_line, linewidth=2, title="Support Level")
plot(resistanceLevel, color=color.purple, style=plot.style_line, linewidth=2, title="Resistance Level")
plot(takeProfitLevel, color=color.green, style=plot.style_line, linewidth=2, title="Take Profit Level")
plot(stopLossLevel, color=color.red, style=plot.style_line, linewidth=2, title="Stop Loss Level")
plot(trailingStopLevel, color=color.orange, style=plot.style_line, linewidth=2, title="Trailing Stop Level")

// Plotting buy and sell signals on the chart
plotshape(series=buyCondition, title="Buy Signal", color=color.green, style=shape.labelup, location=location.belowbar)
plotshape(series=sellCondition, title="Sell Signal", color=color.red, style=shape.labeldown, location=location.abovebar)
- Gold Fast Breakthrough EMA Trading Strategy
- Dual-Factor Momentum Tracking Reversal Strategy
- Momentum Reversal Trading Strategy
- Bollinger Band and RSI Mixing with DCA Strategy
- Emma Pullback Short Strategy
- NoroBands Momentum Position Strategy
- Dual Confirmation Reversal Trend Tracking Strategy
- MACD Indicator Driven OBV Quant Trading Strategy
- Dollar Cost Averaging After Downtrend Strategy
- Triple Indicators Sentiment Driven Breakout Strategy
- Dual Moving Average Strategy
- Momentum Moving Average Crossover Trading Strategy
- Dual Moving Average Golden Cross Strategy
- Momentum Wave Bollinger Bands Trend Strategy
- Reverse Momentum Trading Strategy
- Bandpass Mean PB Indicator Strategy
- RSI & Fibonacci 5-Minute Trading Strategy
- Triple Moving Average Combined with MACD Quantitative Strategy
- Momentum Breakout Optimization
- Baseline Cross Qualifier ATR Volatility & HMA Trend Bias Mean Reversion Strategy