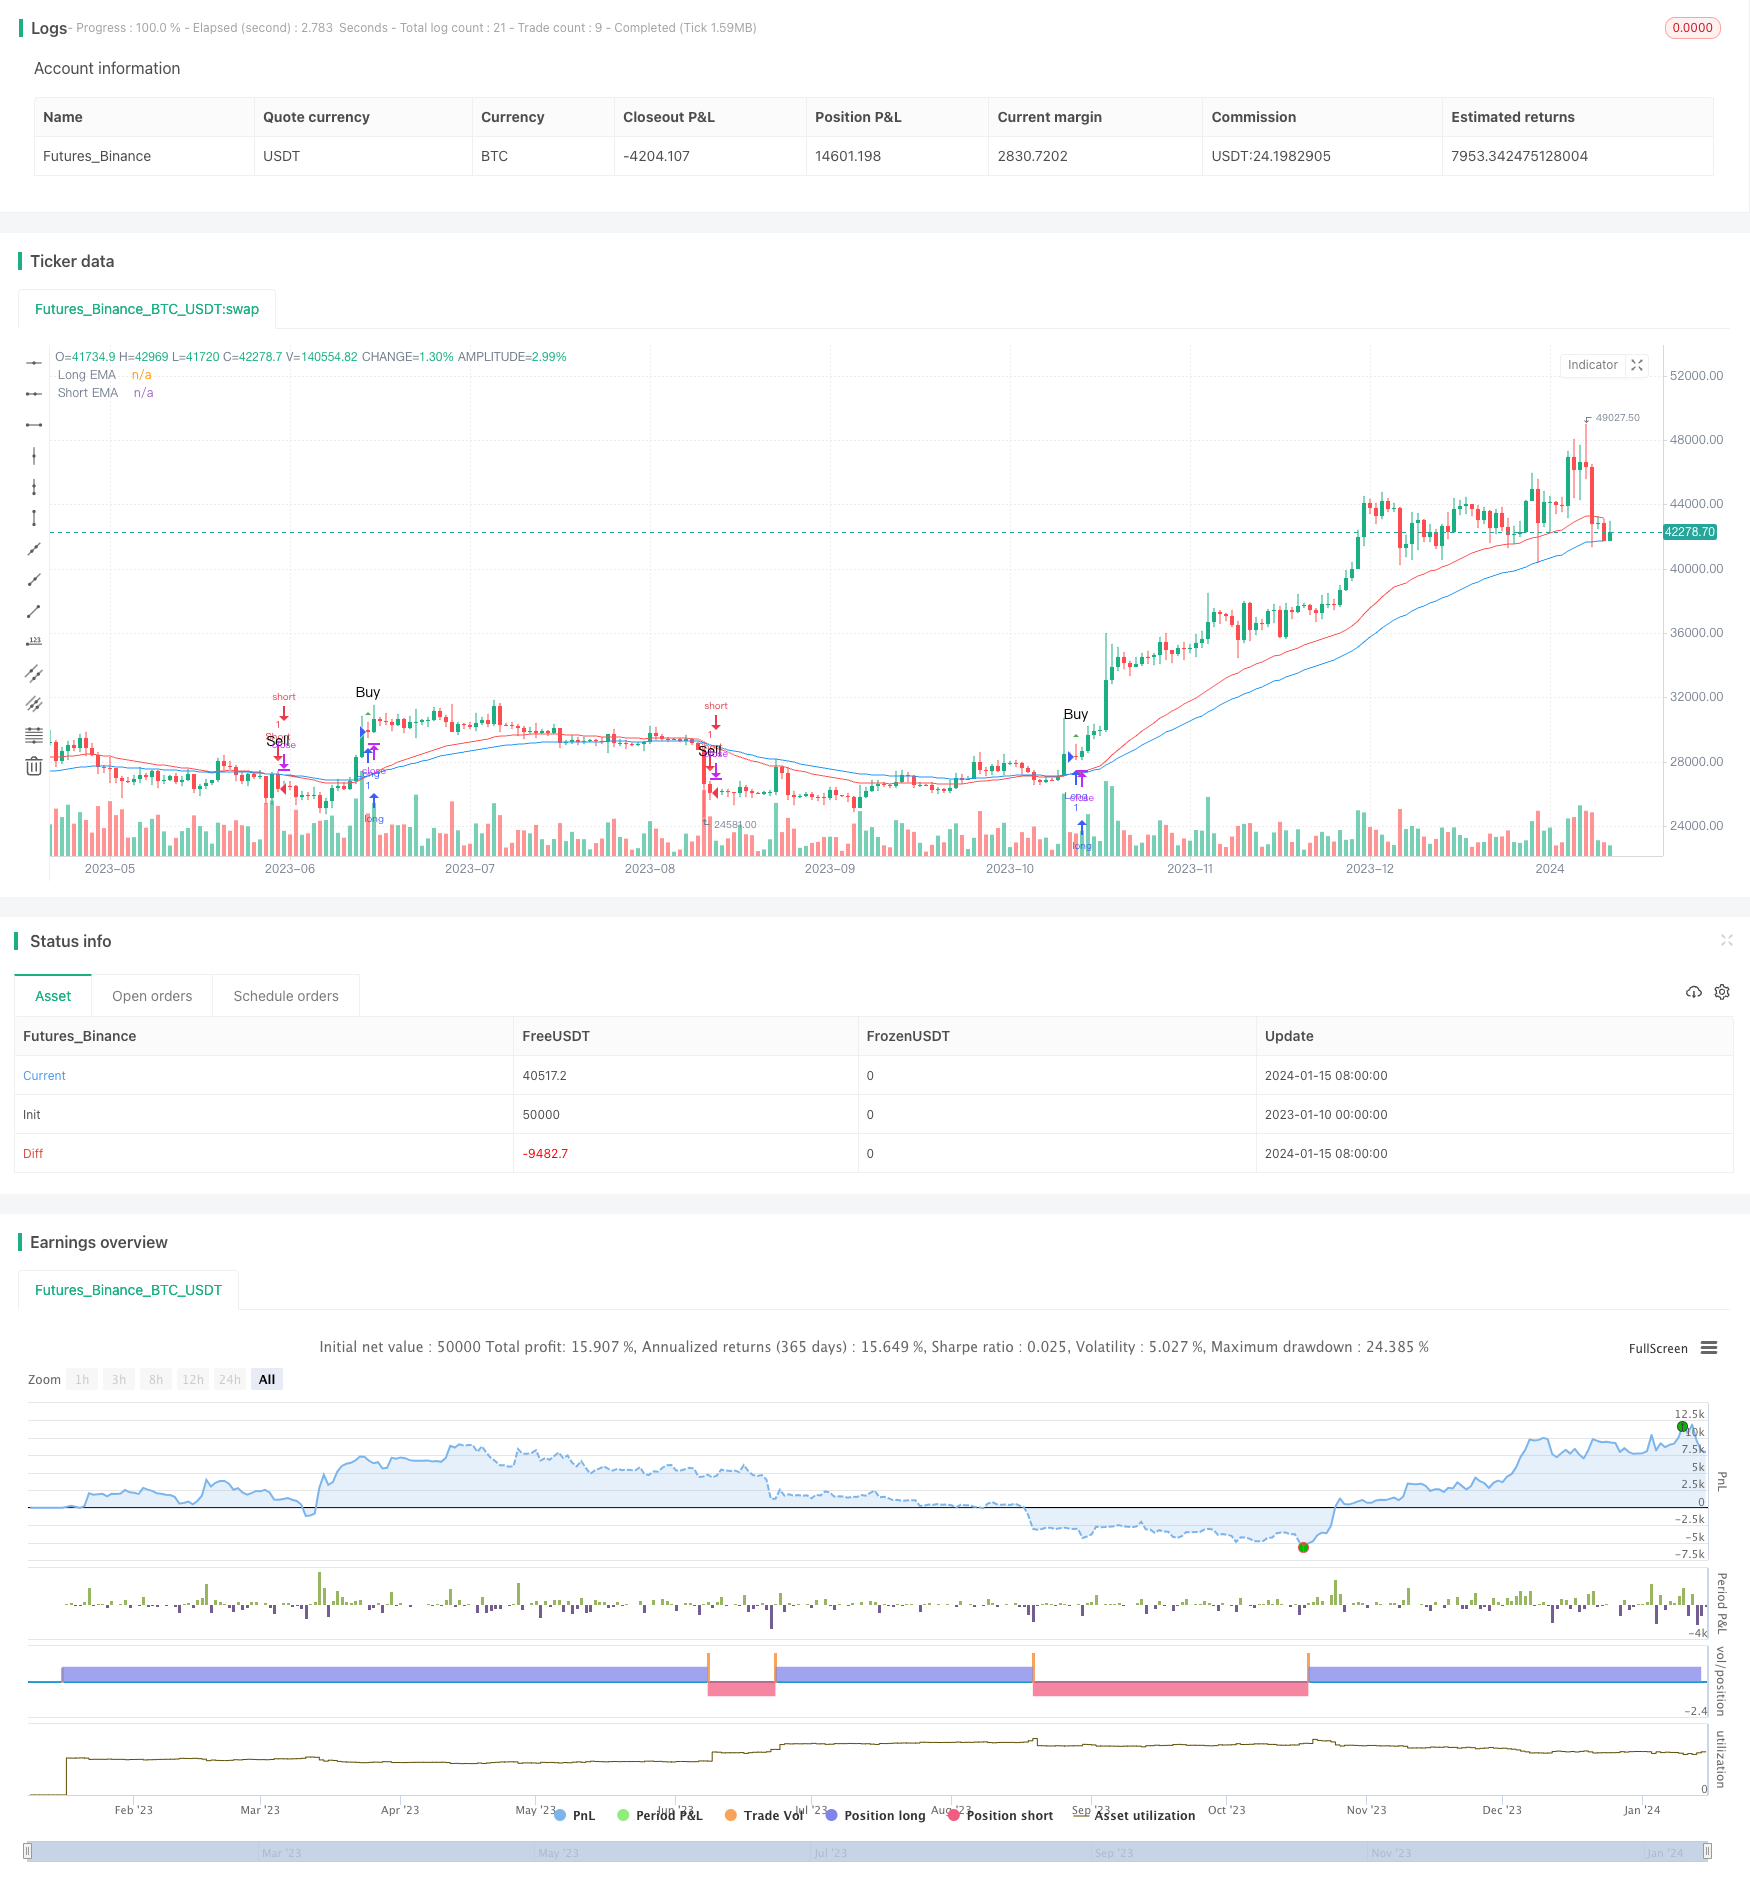
概述
本策略是一个基于均线交叉的动量交易策略。它使用两条不同周期的指数移动平均线(EMA)来识别买卖信号。当快速EMA线从下方上穿慢速EMA线时,产生买入信号;当快速EMA线从上方下穿慢速EMA线时,产生卖出信号。
原理
该策略的核心逻辑基于均线交叉系统。EMA指exponential moving average,即指数移动平均线。EMA的计算公式如下: $\(EMA_t=\frac{P_t \times k}{1+k}+\frac{EMA_{t-1}\times(1-k)}{1+k}\)\( 其中,\)Pt\(表示当日收盘价,\)EMA{t-1}\(表示前一日的EMA值,\)k=\frac{2}{n+1}$,n表示EMA的时间周期。
该策略中的快速EMA周期设置为55,慢速EMA周期设置为34。当短周期EMA从下方上穿长周期EMA时,表示短期均线开始引领长期均线向上,属于金叉信号,产生买入机会。相反,当短周期EMA从上方下穿长周期EMA时,表示短期均线开始落后于长期均线向下,属于死叉信号,产生卖出机会。
优势
该策略具有以下优势:
- 原理简单,容易理解和实现;
- 交易信号明确,指标组合效果良好;
- 可在不同市场环境中灵活使用,适用于高频和低频交易;
- 可通过调整EMA参数进行优化,避免假信号。
风险及解决方法
该策略也存在一定的风险,主要包括:
- 可能产生较多的假信号。解决方法是调整EMA参数,使用更稳定的参数组合。
- 在震荡行情中容易被套。解决方法是结合趋势指标进行过滤。
- 无法判断市场真实走势,存在交易风险。解决方法是与基本面分析和量价指标结合使用。
优化方向
该策略可从以下几个方面进行优化:
- EMA周期优化。可以测试更多的参数组合,找到更合适的快慢EMA周期。
- 增加止损机制。可设置移动止损或百分比止损,控制单笔损失。
- 结合量能指标。可加入成交量,布林带等指标进行过滤,减少假信号。
- 多时间框架验证。可在更高级别的时间框架上验证信号,避免被套。
总结
本策略整体来说是一个非常经典和实用的短线交易策略。它有着简单清晰的交易信号和灵活的应用空间。通过参数优化、指标过滤、风险控制等手段,可以将该策略的效果持续提升,使其成为日内高频交易的重要工具之一。总的来说,该策略具有很高的实践价值,是量化交易的一个基础模块。
策略源码
/*backtest
start: 2023-01-10 00:00:00
end: 2024-01-16 00:00:00
period: 1d
basePeriod: 1h
exchanges: [{"eid":"Futures_Binance","currency":"BTC_USDT"}]
*/

//@version=5
strategy("mohammad tork strategy", overlay=true)

// Input parameters
lengthShortEMA = input(55, title="Short EMA Length")
lengthLongEMA = input(34, title="Long EMA Length")

// Calculate EMAs
emaShort = ta.ema(close, lengthShortEMA)
emaLong = ta.ema(close, lengthLongEMA)

// Conditions for Long Signal
longCondition = ta.crossover(emaLong, emaShort)

// Conditions for Short Signal
shortCondition = ta.crossunder(emaLong, emaShort)

// Execute Long Signal
strategy.entry("Long", strategy.long, when = longCondition)

// Execute Short Signal
strategy.entry("Short", strategy.short, when = shortCondition)

// Plot EMAs on the chart
plot(emaShort, color=color.blue, title="Short EMA")
plot(emaLong, color=color.red, title="Long EMA")

// Plot Long Signal Icon with Buy Label
plotshape(series=longCondition, title="Long Signal", color=color.green, style=shape.triangleup, location=location.abovebar, size=size.small, text="Buy")

// Plot Short Signal Icon with Sell Label
plotshape(series=shortCondition, title="Short Signal", color=color.red, style=shape.triangledown, location=location.abovebar, size=size.small, text="Sell")